Are Investors Undervaluing Heartland Express, Inc. (NASDAQ:HTLD) By 49%?
Key Insights
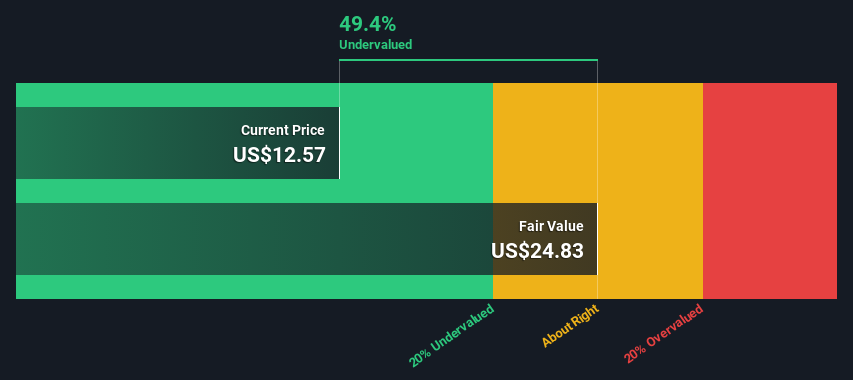
Heartland Express' estimated fair value is US$24.83 based on 2 Stage Free Cash Flow to Equity
Heartland Express is estimated to be 49% undervalued based on current share price of US$12.57
Our fair value estimate is 75% higher than Heartland Express' analyst price target of US$14.17
Today we will run through one way of estimating the intrinsic value of Heartland Express, Inc. (NASDAQ:HTLD) by projecting its future cash flows and then discounting them to today's value. The Discounted Cash Flow (DCF) model is the tool we will apply to do this. Believe it or not, it's not too difficult to follow, as you'll see from our example!
Companies can be valued in a lot of ways, so we would point out that a DCF is not perfect for every situation. If you still have some burning questions about this type of valuation, take a look at the Simply Wall St analysis model.
Check out our latest analysis for Heartland Express
The Model
We're using the 2-stage growth model, which simply means we take in account two stages of company's growth. In the initial period the company may have a higher growth rate and the second stage is usually assumed to have a stable growth rate. In the first stage we need to estimate the cash flows to the business over the next ten years. Where possible we use analyst estimates, but when these aren't available we extrapolate the previous free cash flow (FCF) from the last estimate or reported value. We assume companies with shrinking free cash flow will slow their rate of shrinkage, and that companies with growing free cash flow will see their growth rate slow, over this period. We do this to reflect that growth tends to slow more in the early years than it does in later years.
Generally we assume that a dollar today is more valuable than a dollar in the future, so we need to discount the sum of these future cash flows to arrive at a present value estimate:
10-year free cash flow (FCF) forecast
2024 | 2025 | 2026 | 2027 | 2028 | 2029 | 2030 | 2031 | 2032 | 2033 | |
Levered FCF ($, Millions) | US$100.0m | US$106.1m | US$111.3m | US$115.8m | US$119.9m | US$123.7m | US$127.2m | US$130.6m | US$134.0m | US$137.2m |
Growth Rate Estimate Source | Analyst x1 | Est @ 6.06% | Est @ 4.91% | Est @ 4.10% | Est @ 3.54% | Est @ 3.14% | Est @ 2.87% | Est @ 2.67% | Est @ 2.54% | Est @ 2.44% |
Present Value ($, Millions) Discounted @ 7.9% | US$92.7 | US$91.2 | US$88.7 | US$85.6 | US$82.1 | US$78.5 | US$74.9 | US$71.3 | US$67.8 | US$64.4 |
("Est" = FCF growth rate estimated by Simply Wall St)
Present Value of 10-year Cash Flow (PVCF) = US$797m
The second stage is also known as Terminal Value, this is the business's cash flow after the first stage. The Gordon Growth formula is used to calculate Terminal Value at a future annual growth rate equal to the 5-year average of the 10-year government bond yield of 2.2%. We discount the terminal cash flows to today's value at a cost of equity of 7.9%.
Terminal Value (TV)= FCF2033 × (1 + g) ÷ (r – g) = US$137m× (1 + 2.2%) ÷ (7.9%– 2.2%) = US$2.5b
Present Value of Terminal Value (PVTV)= TV / (1 + r)10= US$2.5b÷ ( 1 + 7.9%)10= US$1.2b
The total value, or equity value, is then the sum of the present value of the future cash flows, which in this case is US$2.0b. In the final step we divide the equity value by the number of shares outstanding. Relative to the current share price of US$12.6, the company appears quite undervalued at a 49% discount to where the stock price trades currently. The assumptions in any calculation have a big impact on the valuation, so it is better to view this as a rough estimate, not precise down to the last cent.
The Assumptions
The calculation above is very dependent on two assumptions. The first is the discount rate and the other is the cash flows. You don't have to agree with these inputs, I recommend redoing the calculations yourself and playing with them. The DCF also does not consider the possible cyclicality of an industry, or a company's future capital requirements, so it does not give a full picture of a company's potential performance. Given that we are looking at Heartland Express as potential shareholders, the cost of equity is used as the discount rate, rather than the cost of capital (or weighted average cost of capital, WACC) which accounts for debt. In this calculation we've used 7.9%, which is based on a levered beta of 1.129. Beta is a measure of a stock's volatility, compared to the market as a whole. We get our beta from the industry average beta of globally comparable companies, with an imposed limit between 0.8 and 2.0, which is a reasonable range for a stable business.
SWOT Analysis for Heartland Express
Strength
Debt is well covered by cash flow.
Weakness
Earnings declined over the past year.
Interest payments on debt are not well covered.
Dividend is low compared to the top 25% of dividend payers in the Transportation market.
Opportunity
Annual earnings are forecast to grow faster than the American market.
Trading below our estimate of fair value by more than 20%.
Significant insider buying over the past 3 months.
Threat
Annual revenue is expected to decline over the next 3 years.
Moving On:
Although the valuation of a company is important, it ideally won't be the sole piece of analysis you scrutinize for a company. It's not possible to obtain a foolproof valuation with a DCF model. Rather it should be seen as a guide to "what assumptions need to be true for this stock to be under/overvalued?" If a company grows at a different rate, or if its cost of equity or risk free rate changes sharply, the output can look very different. What is the reason for the share price sitting below the intrinsic value? For Heartland Express, there are three further elements you should look at:
Risks: Case in point, we've spotted 2 warning signs for Heartland Express you should be aware of.
Management:Have insiders been ramping up their shares to take advantage of the market's sentiment for HTLD's future outlook? Check out our management and board analysis with insights on CEO compensation and governance factors.
Other High Quality Alternatives: Do you like a good all-rounder? Explore our interactive list of high quality stocks to get an idea of what else is out there you may be missing!
PS. Simply Wall St updates its DCF calculation for every American stock every day, so if you want to find the intrinsic value of any other stock just search here.
Have feedback on this article? Concerned about the content? Get in touch with us directly. Alternatively, email editorial-team (at) simplywallst.com.
This article by Simply Wall St is general in nature. We provide commentary based on historical data and analyst forecasts only using an unbiased methodology and our articles are not intended to be financial advice. It does not constitute a recommendation to buy or sell any stock, and does not take account of your objectives, or your financial situation. We aim to bring you long-term focused analysis driven by fundamental data. Note that our analysis may not factor in the latest price-sensitive company announcements or qualitative material. Simply Wall St has no position in any stocks mentioned.
