Are Investors Undervaluing Seanergy Maritime Holdings Corp. (NASDAQ:SHIP) By 20%?
Key Insights
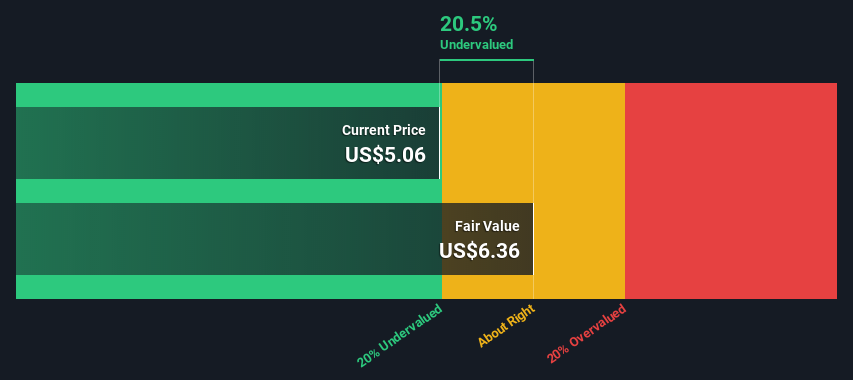
Using the 2 Stage Free Cash Flow to Equity, Seanergy Maritime Holdings fair value estimate is US$6.36
Seanergy Maritime Holdings' US$5.06 share price signals that it might be 20% undervalued
Analyst price target for SHIP is US$10.67, which is 68% above our fair value estimate
How far off is Seanergy Maritime Holdings Corp. (NASDAQ:SHIP) from its intrinsic value? Using the most recent financial data, we'll take a look at whether the stock is fairly priced by estimating the company's future cash flows and discounting them to their present value. The Discounted Cash Flow (DCF) model is the tool we will apply to do this. Don't get put off by the jargon, the math behind it is actually quite straightforward.
We generally believe that a company's value is the present value of all of the cash it will generate in the future. However, a DCF is just one valuation metric among many, and it is not without flaws. If you still have some burning questions about this type of valuation, take a look at the Simply Wall St analysis model.
See our latest analysis for Seanergy Maritime Holdings
The Model
We're using the 2-stage growth model, which simply means we take in account two stages of company's growth. In the initial period the company may have a higher growth rate and the second stage is usually assumed to have a stable growth rate. To start off with, we need to estimate the next ten years of cash flows. Where possible we use analyst estimates, but when these aren't available we extrapolate the previous free cash flow (FCF) from the last estimate or reported value. We assume companies with shrinking free cash flow will slow their rate of shrinkage, and that companies with growing free cash flow will see their growth rate slow, over this period. We do this to reflect that growth tends to slow more in the early years than it does in later years.
Generally we assume that a dollar today is more valuable than a dollar in the future, and so the sum of these future cash flows is then discounted to today's value:
10-year free cash flow (FCF) estimate
2023 | 2024 | 2025 | 2026 | 2027 | 2028 | 2029 | 2030 | 2031 | 2032 | |
Levered FCF ($, Millions) | US$94.3m | US$35.7m | US$15.2m | US$9.22m | US$6.73m | US$5.50m | US$4.83m | US$4.44m | US$4.23m | US$4.11m |
Growth Rate Estimate Source | Analyst x1 | Analyst x2 | Est @ -57.31% | Est @ -39.50% | Est @ -27.03% | Est @ -18.30% | Est @ -12.19% | Est @ -7.91% | Est @ -4.92% | Est @ -2.82% |
Present Value ($, Millions) Discounted @ 26% | US$74.6 | US$22.4 | US$7.6 | US$3.6 | US$2.1 | US$1.3 | US$0.9 | US$0.7 | US$0.5 | US$0.4 |
("Est" = FCF growth rate estimated by Simply Wall St)
Present Value of 10-year Cash Flow (PVCF) = US$114m
After calculating the present value of future cash flows in the initial 10-year period, we need to calculate the Terminal Value, which accounts for all future cash flows beyond the first stage. The Gordon Growth formula is used to calculate Terminal Value at a future annual growth rate equal to the 5-year average of the 10-year government bond yield of 2.1%. We discount the terminal cash flows to today's value at a cost of equity of 26%.
Terminal Value (TV)= FCF2032 × (1 + g) ÷ (r – g) = US$4.1m× (1 + 2.1%) ÷ (26%– 2.1%) = US$17m
Present Value of Terminal Value (PVTV)= TV / (1 + r)10= US$17m÷ ( 1 + 26%)10= US$1.7m
The total value is the sum of cash flows for the next ten years plus the discounted terminal value, which results in the Total Equity Value, which in this case is US$116m. To get the intrinsic value per share, we divide this by the total number of shares outstanding. Relative to the current share price of US$5.1, the company appears a touch undervalued at a 20% discount to where the stock price trades currently. Valuations are imprecise instruments though, rather like a telescope - move a few degrees and end up in a different galaxy. Do keep this in mind.
The Assumptions
We would point out that the most important inputs to a discounted cash flow are the discount rate and of course the actual cash flows. Part of investing is coming up with your own evaluation of a company's future performance, so try the calculation yourself and check your own assumptions. The DCF also does not consider the possible cyclicality of an industry, or a company's future capital requirements, so it does not give a full picture of a company's potential performance. Given that we are looking at Seanergy Maritime Holdings as potential shareholders, the cost of equity is used as the discount rate, rather than the cost of capital (or weighted average cost of capital, WACC) which accounts for debt. In this calculation we've used 26%, which is based on a levered beta of 2.000. Beta is a measure of a stock's volatility, compared to the market as a whole. We get our beta from the industry average beta of globally comparable companies, with an imposed limit between 0.8 and 2.0, which is a reasonable range for a stable business.
SWOT Analysis for Seanergy Maritime Holdings
Strength
No major strengths identified for SHIP.
Weakness
Earnings declined over the past year.
Interest payments on debt are not well covered.
Dividend is low compared to the top 25% of dividend payers in the Shipping market.
Shareholders have been diluted in the past year.
Opportunity
Trading below our estimate of fair value by more than 20%.
Threat
Debt is not well covered by operating cash flow.
Dividends are not covered by earnings.
Annual earnings are forecast to decline for the next 2 years.
Next Steps:
Although the valuation of a company is important, it is only one of many factors that you need to assess for a company. It's not possible to obtain a foolproof valuation with a DCF model. Rather it should be seen as a guide to "what assumptions need to be true for this stock to be under/overvalued?" For instance, if the terminal value growth rate is adjusted slightly, it can dramatically alter the overall result. Why is the intrinsic value higher than the current share price? For Seanergy Maritime Holdings, we've put together three additional factors you should consider:
Risks: Every company has them, and we've spotted 6 warning signs for Seanergy Maritime Holdings (of which 3 shouldn't be ignored!) you should know about.
Future Earnings: How does SHIP's growth rate compare to its peers and the wider market? Dig deeper into the analyst consensus number for the upcoming years by interacting with our free analyst growth expectation chart.
Other Solid Businesses: Low debt, high returns on equity and good past performance are fundamental to a strong business. Why not explore our interactive list of stocks with solid business fundamentals to see if there are other companies you may not have considered!
PS. Simply Wall St updates its DCF calculation for every American stock every day, so if you want to find the intrinsic value of any other stock just search here.
Have feedback on this article? Concerned about the content? Get in touch with us directly. Alternatively, email editorial-team (at) simplywallst.com.
This article by Simply Wall St is general in nature. We provide commentary based on historical data and analyst forecasts only using an unbiased methodology and our articles are not intended to be financial advice. It does not constitute a recommendation to buy or sell any stock, and does not take account of your objectives, or your financial situation. We aim to bring you long-term focused analysis driven by fundamental data. Note that our analysis may not factor in the latest price-sensitive company announcements or qualitative material. Simply Wall St has no position in any stocks mentioned.
Join A Paid User Research Session
You’ll receive a US$30 Amazon Gift card for 1 hour of your time while helping us build better investing tools for the individual investors like yourself. Sign up here
