IQVIA Holdings Inc (IQV): Can It Deliver A Superior ROE To The Industry?

IQVIA Holdings Inc’s (NYSE:IQV) most recent return on equity was a substandard 1.89% relative to its industry performance of 14.04% over the past year. Though IQV’s recent performance is underwhelming, it is useful to understand what ROE is made up of and how it should be interpreted. Knowing these components can change your views on IQV’s below-average returns. Today I will look at how components such as financial leverage can influence ROE which may impact the sustainability of IQV’s returns. See our latest analysis for IQV
Breaking down Return on Equity
Firstly, Return on Equity, or ROE, is simply the percentage of last years’ earning against the book value of shareholders’ equity. For example, if IQV invests $1 in the form of equity, it will generate $0.02 in earnings from this. In most cases, a higher ROE is preferred; however, there are many other factors we must consider prior to making any investment decisions.
Return on Equity = Net Profit ÷ Shareholders Equity
ROE is assessed against cost of equity, which is measured using the Capital Asset Pricing Model (CAPM) – but let’s not dive into the details of that today. For now, let’s just look at the cost of equity number for IQV, which is 10.84%. Since IQV’s return does not cover its cost, with a difference of -8.96%, this means its current use of equity is not efficient and not sustainable. Very simply, IQV pays more for its capital than what it generates in return. ROE can be dissected into three distinct ratios: net profit margin, asset turnover, and financial leverage. This is called the Dupont Formula:
Dupont Formula
ROE = profit margin × asset turnover × financial leverage
ROE = (annual net profit ÷ sales) × (sales ÷ assets) × (assets ÷ shareholders’ equity)
ROE = annual net profit ÷ shareholders’ equity

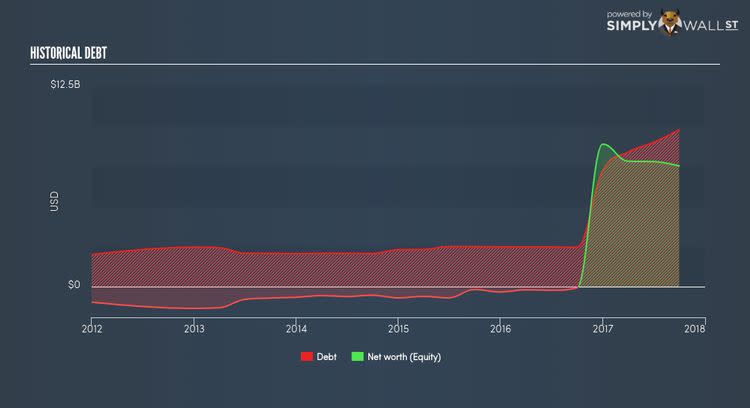
Basically, profit margin measures how much of revenue trickles down into earnings which illustrates how efficient IQV is with its cost management. Asset turnover shows how much revenue IQV can generate with its current asset base. Finally, financial leverage will be our main focus today. It shows how much of assets are funded by equity and can show how sustainable IQV’s capital structure is. Since ROE can be artificially increased through excessive borrowing, we should check IQV’s historic debt-to-equity ratio. The debt-to-equity ratio currently stands at a balanced 130.09%, meaning the ROE is a result of its capacity to produce profit growth without a huge debt burden.
What this means for you:
Are you a shareholder? IQV exhibits a weak ROE against its peers, as well as insufficient levels to cover its own cost of equity this year. Since its existing ROE is not fuelled by unsustainable debt, investors shouldn’t give up as IQV still has capacity to improve shareholder returns by borrowing to invest in new projects in the future. If you’re looking for new ideas for high-returning stocks, you should take a look at our free platform to see the list of stocks with Return on Equity over 20%.
Are you a potential investor? If you are considering investing in IQV, basing your decision on ROE alone is certainly not sufficient. I recommend you do additional fundamental analysis by looking through our most recent infographic report on IQVIA Holdings to help you make a more informed investment decision.
To help readers see pass the short term volatility of the financial market, we aim to bring you a long-term focused research analysis purely driven by fundamental data. Note that our analysis does not factor in the latest price sensitive company announcements.
The author is an independent contributor and at the time of publication had no position in the stocks mentioned.
