ITT Inc: A Strong Contender in the Industrial Products Sector with Good Outperformance Potential
ITT Inc (NYSE:ITT), a prominent player in the Industrial Products sector, is currently trading at $101.51 with a market capitalization of $8.36 billion. The company's stock has seen a gain of 3.29% today and a significant increase of 9.88% over the past four weeks. This article will delve into the company's GF Score and its components, providing a comprehensive analysis of ITT's financial strength, profitability, growth, value, and momentum.
ITT Inc's GF Score Analysis
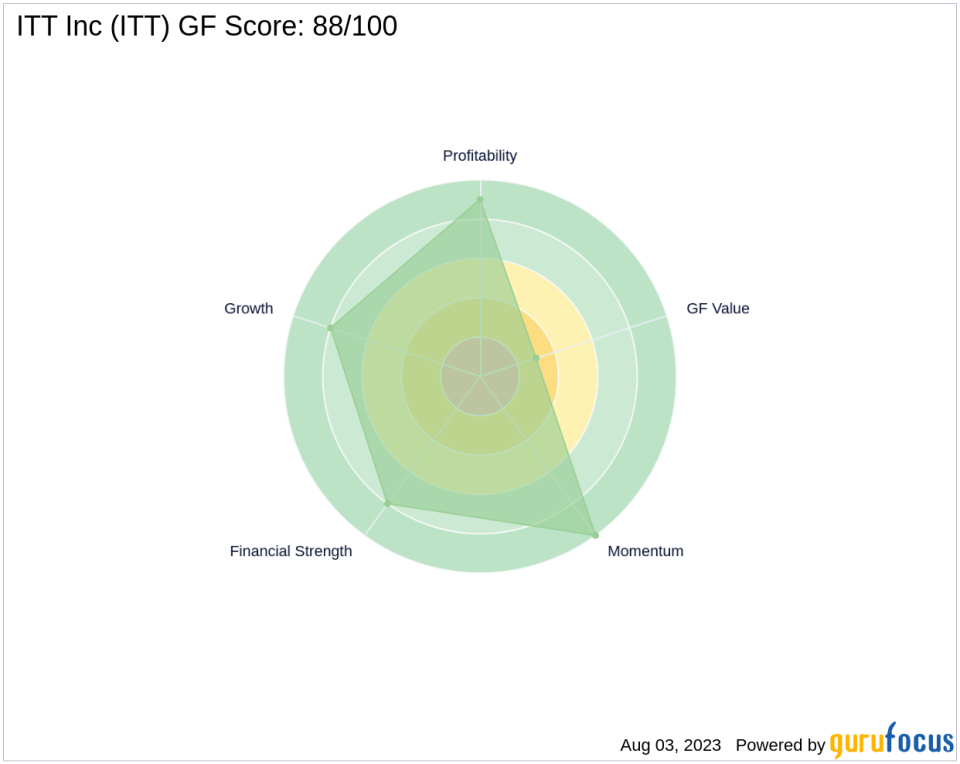
ITT Inc's GF Score stands at 88 out of 100, indicating good outperformance potential. The GF Score is a stock performance ranking system developed by GuruFocus, which is closely correlated to the long-term performances of stocks. It takes into account five key aspects: Financial Strength, Profitability Rank, Growth Rank, GF Value Rank, and Momentum Rank. A higher GF Score generally suggests higher returns, making ITT Inc an attractive investment option.
Financial Strength Analysis
ITT Inc's Financial Strength Rank is 8 out of 10, indicating a robust financial situation. This rank is determined by factors such as interest coverage (51.81), debt to revenue ratio (0.15), and Altman Z score (5.74). The company's high interest coverage and low debt to revenue ratio suggest a low debt burden, while the high Altman Z score indicates a low probability of bankruptcy.
Profitability Rank Analysis
The company's Profitability Rank is 9 out of 10, reflecting high profitability. This rank is based on factors such as Operating Margin (15.92%), Piotroski F-Score (7), and a consistent profitability trend over the past 10 years. The high rank suggests that ITT Inc's business is likely to remain profitable.
Growth Rank Analysis
ITT Inc's Growth Rank is 8 out of 10, indicating strong growth potential. This rank is determined by the 5-year revenue growth rate (2.90), 3-year revenue growth rate (3.60), and 5-year EBITDA growth rate (6.20). The high rank suggests that the company has consistently grown its revenue and profitability over the years.
GF Value Rank Analysis
The company's GF Value Rank is 3 out of 10, suggesting that the stock is currently overvalued. This rank is determined by the price-to-GF-Value ratio, a proprietary metric calculated based on historical multiples and an adjustment factor based on a company's past returns and growth.
Momentum Rank Analysis
ITT Inc's Momentum Rank is 10 out of 10, indicating strong momentum. This rank is determined using the standardized momentum ratio and other momentum indicators. The high rank suggests that the company's stock price is likely to continue its upward trend.
Competitive Analysis
When compared to its main competitors in the Industrial Products industry, ITT Inc holds a strong position. The Middleby Corp (NASDAQ:MIDD) has a GF Score of 93, Donaldson Co Inc (NYSE:DCI) has a GF Score of 87, and Chart Industries Inc (NYSE:GTLS) has a GF Score of 83. Despite the stiff competition, ITT Inc's high GF Score of 88 indicates its strong performance potential.
Conclusion
In conclusion, ITT Inc's high GF Score and its components suggest that the company has a strong financial situation, high profitability, strong growth potential, and strong momentum. However, the company's low GF Value Rank indicates that the stock is currently overvalued. Despite this, ITT Inc remains a strong contender in the Industrial Products sector with good outperformance potential.
This article first appeared on GuruFocus.
