IZEA Reports All-Time Record Revenues and Bookings in Q3 2021
IZEA Q3 2021 Bookings Conversion Chart
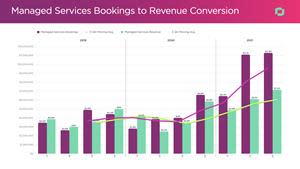
A comparison of Managed Services Bookings to Revenue Conversion by quarter from 2019-2021.
ORLANDO, Fla., Nov. 10, 2021 (GLOBE NEWSWIRE) -- IZEA Worldwide, Inc. (NASDAQ: IZEA), the premier provider of influencer marketing technology, data, and services for the world’s leading brands, reported its financial and operational results for the third quarter ended September 30, 2021.
Q3 2021 Financial Summary Compared to Q3 2020
Total revenue increased 88% to an all-time record $7.6 million, compared to $4.0 million.
Managed Services unit revenue increased 104% to $7.2 million, compared to $3.5 million.
SaaS Services unit revenue decreased 13% to $454,000, compared to $522,000.
Total costs and expenses increased 72% to $9.1 million, compared to $5.3 million.
Net loss was $1.5 million, compared to a net loss of $1.3 million.
Adjusted EBITDA* decreased to $(1.0) million, compared to $(0.7) million.
Q3 2021 Operational Highlights
Hit all-time record count of customers licensing IZEA SaaS products.
Managed Services bookings reached 181% year over year growth in Q3 to hit an all-time record of $11.3 million.
Announced Partnership with Multicart to Power Social Commerce
Added The Cut to IZEA’s Talent Partner Program.
* Adjusted EBITDA is a non-GAAP financial measure. Refer to the definition and reconciliation of this measure under “Use of Key Metrics and Non-GAAP Financial Measures”.
Management Commentary
“IZEA’s strong sales momentum in Q3 was a continuation and acceleration of what we have delivered throughout 2021,” said Ted Murphy, IZEA’s Chairman and CEO. “Investment in sales and marketing resulted in more than double the new managed service customers added in the quarter vs. the same quarter last year. Those new customers, combined with increases from existing customers, led to all-time record bookings and revenue in the quarter.”
“At the end of 2020 our team set forth a goal to deliver at least 30% annual revenue growth per year for each of the next three years, or a 30% compound annual growth rate,” continued Murphy. “Based on that rate of 30% growth per year, our goal was to achieve revenues of approximately $23.8 million in 2021, and $31 million in 2022. We are on pace to beat our revenue goal for 2021 and are well positioned to do the same in 2022. Year to date revenue through Q3 of this year already totals $19.5M, and we are heading into a historically strong quarter for IZEA bookings and revenue recognition.”
“Team IZEA is off to a great start in Q4 with the wind at our back from previous quarters. October was the best October we have ever had for Managed Services bookings and our team is focused on closing out 2021 on a strong note,” continued Murphy. “We recognize that we remain in the midst of a global pandemic, with supply chain and labor shortages that have impacted many of our customers in a variety of ways. Some of those customers, particularly those in the travel industry, are still far from pre-covid operations and it is unclear if or when they will fully recover. With that said, our overall outlook for 2022 today is incredibly positive. We are bullish on continued growth based on the early indications of renewals from some of our larger clients.”
Q3 2021 Financial Results
Total revenue in the third quarter of 2021 increased 88% to $7.6 million, compared to $4.0 million in the third quarter of 2020, with revenue from Managed Services increasing by $3.6 million, or 104%, to $7.2 million in the third quarter of 2021 compared to the third quarter of 2020 and revenue from SaaS Services decreasing by $68,000, or 13%, to $454,029 in the third quarter of 2021 compared to the third quarter of 2020.
Revenue from Managed Services improved on the strength of recent prior quarter bookings growth and an increase in completed campaigns during the quarter; demand for Managed Services continues to increase as many customers are shifting more of their marketing spend to influencer marketing campaigns.
Revenue from SaaS Services decreased primarily as a result of lower license fees and lower margins on self-service marketplace spending. Licensee counts on all platforms are growing, however average license fees are lower due to competitive changes we implemented in the summer of 2020 in response to COVID-related churn. We also lowered our pricing on selected self-service offerings during the third quarter of 2020, which impacted our current quarter margins on marketplace spending. Gross billings (a key metric, as further defined below) for SaaS Services decreased 27% to $1.5 million in Q3 2021, compared to $2.0 million in Q3 2020. Certain of our SaaS marketers decreased their spend levels as they transitioned from the TapInfluence platform to IZEAx and curtailed spending throughout 2020.
Cost of revenue exclusive of amortization was $4.0 million in Q3 2021, or 52% of Revenue, compared to $1.7 million, or 42% in the prior year quarter, higher primarily due to a heavier mix of larger deals that carry lower overall margins. Costs and expenses other than cost of revenue totaled $5.1 million for the current quarter compared to $3.6 million for the prior year quarter. Sales and marketing costs were $2.2 million during the quarter, $0.8 million or 60% above the comparative quarter due to sales compensation, which varies with higher bookings and marketing costs associated with driving customer growth. General and administrative costs totaled $2.7 million during the quarter, $843,518 or 46% above the prior year quarter, due primarily to higher compensation and contractor costs to support operations and IT investments.
Net loss in the third quarter of 2021 was $1.5 million, or $(0.02) per share, as compared to a net loss of $1.3 million, or $(0.03) per share in the third quarter of 2020, based on 61.9 million and 45.8 million average shares outstanding, respectively.
Adjusted EBITDA (a non-GAAP measure management uses as a proxy for operating cash flow, as defined below) declined 39%, or $281,127, to $(1.0) million in the third quarter of 2021 compared to $(0.7) million in the third quarter of 2020. Adjusted EBITDA as a percentage of revenue in the third quarter of 2021 was negative (13)% compared to negative (18)% in the third quarter of 2020.
Our cash balance as of September 30, 2021 was $74.5 million. The Company has no long-term debt.
Conference Call
IZEA will hold a conference call to discuss its third quarter 2021 results on Wednesday, November 10th at 5:00 p.m. Eastern Standard Time. IZEA's Chairman and CEO Ted Murphy, CFO Peter Biere, and COO Ryan Schram will host the call, followed by a question and answer period.
Date: Wednesday, November 10, 2021
Time: 5:00 p.m. Eastern Standard Time
Toll-free dial-in number: 1-800-786-8691
International dial-in number: 1-416-981-9029
Please call the conference telephone number five minutes prior to the start time. An operator will register your name and organization. A replay of the call will be available after 8:00 p.m. ET on the same day through November 17, 2021.
Toll-free replay number: 1-844-512-2921
International replay number: 1-412-317-6671
Replay ID: 21998780
About IZEA Worldwide, Inc.
IZEA Worldwide, Inc. (“IZEA”) is a marketing technology company providing software and professional services that enable brands to collaborate and transact with the full spectrum of today’s top social influencers and content creators. The company serves as a champion for the growing Creator Economy, enabling individuals to monetize their content, creativity, and influence. IZEA launched the industry’s first-ever influencer marketing platform in 2006 and has since facilitated nearly 4 million transactions between online buyers and sellers. Leading brands and agencies partner with IZEA to increase digital engagement, diversify brand voice, scale content production, and drive measurable return on investment.
Use of Key Metrics and Non-GAAP Financial Measures
We define gross billings, a key metric, as the total dollar value of the amounts earned from our customers for the services we performed, or the amounts billed to our customers for their self-service purchase of goods and services on our platforms. Gross billings for Marketplace Spend are the amounts of our reported revenue plus the cost of payments we made to third-party creators providing the content or sponsorship services, which are netted against revenue for generally accepted accounting principles in the United States (“GAAP”) reporting purposes. Gross billings for all other revenue types equals the revenue reported in our consolidated statements of operations.
Managed Services bookings is a measure of all sales orders received during a time period less any cancellations received, or refunds given during the same time period. Sales order contracts vary in complexity with each customer and range from custom content delivery to integrated marketing services; our contracts generally run from several months for smaller contracts up to twelve months for larger contracts. We recognize revenue from our Managed Services contracts based on a percentage of completion basis as we deliver the content or services over time, which can vary greatly. Historically, bookings have converted to revenues over a 6-month period on average. However, since late 2020, we have received increasingly larger and more complex sales orders which, in turn, has lengthened the average revenue period to approximately 9 months, with the largest contracts taking longer to complete. For this reason, Managed Services bookings, while an overall indicator of the health of our business, may not be used to predict quarterly revenues, and could be subject to future adjustment.
Managed Services bookings is useful information as it reflects the amount of orders received in one period, even though revenue from those orders may be reflected over varying amounts of time. Management uses the Managed Services bookings metric to plan its operating staff, to identify key customer group trends to enlighten go-to-market activities, and to inform its product development efforts.
"Adjusted EBITDA" is a non-GAAP financial measure under the rules of the Securities and Exchange Commission. EBITDA is commonly defined as "earnings before interest, taxes, depreciation and amortization." IZEA defines “Adjusted EBITDA” as earnings or loss before interest, taxes, depreciation and amortization, non-cash stock-based compensation, gain or loss on asset disposals or impairment, and certain other unusual or non-cash income and expense items such as gains or losses on settlement of liabilities and exchanges, and changes in the fair value of derivatives, if applicable.
We believe that Adjusted EBITDA provides useful information to investors as it primarily excludes non-cash transactions, and it provides consistency to facilitate period-to-period comparisons.
All companies do not calculate gross billings, bookings and Adjusted EBITDA in the same manner. These metrics as presented by IZEA may not be comparable to those presented by other companies. Moreover, these metrics have limitations as analytical tools, and you should not consider them in isolation or as a substitute for an analysis of our results of operations as reported under GAAP. A reconciliation of GAAP to non-GAAP results is presented in the financial tables included in this press release.
Safe Harbor Statement
All statements in this release that are not based on historical fact are “forward-looking statements” intended to qualify for the safe harbor from liability established by the Private Securities Litigation Reform Act of 1995. Forward-looking statements, which are based on certain assumptions and describe our future plans, strategies and expectations, can generally be identified by the use of forward-looking terms such as “may,” “will,” “would,” “could,” “should,” “expect,” “anticipate,” “hope,” “estimate,” “believe,” “intend,” "likely," "projects," “plans,” "pursue," "strategy," "goal" or "future," or the negative of these words or other words or expressions of similar meaning. Examples of forward-looking statements include, among others, statements we make regarding our goals for revenue growth in future periods, performance under customer contracts, expectations of operating results that remain subject to completion of financial closing procedures, IZEA’s ability to increase revenue and bookings, growth or maintenance of customer relationships, and expectations concerning industry trends or IZEA’s business strategy. Forward-looking statements involve inherent risks and uncertainties which could cause actual results to differ materially from those in the forward-looking statements, as a result of various factors including, among others, the following: competitive conditions in the content and social sponsorship segment in which IZEA operates; failure to popularize one or more of the marketplace platforms of IZEA; our ability to establish effective disclosure controls and procedures and internal control over financial reporting; our ability to satisfy the requirements for continued listing of our common stock on the Nasdaq Capital Market; changing economic conditions that are less favorable than expected; and other risks and uncertainties described in IZEA’s periodic reports filed with the Securities and Exchange Commission. The forward-looking statements made in this release speak only as of the date of this release, and IZEA assumes no obligation to update any such forward-looking statements to reflect actual results or changes in expectations, except as otherwise required by law.
Press Contact
Martin Smith
IZEA Worldwide, Inc.
Phone: 407-674-6911
Email: ir@izea.com
IZEA Worldwide, Inc.
Consolidated Balance Sheets
September 30, | December 31, | ||||||
Assets | |||||||
Current assets: | |||||||
Cash and cash equivalents | $ | 74,451,857 | $ | 33,045,225 | |||
Accounts receivable, net | 7,093,028 | 5,207,205 | |||||
Prepaid expenses | 1,646,895 | 199,294 | |||||
Other current assets | 40,853 | 74,467 | |||||
Total current assets | 83,232,633 | 38,526,191 | |||||
Property and equipment, net | 157,769 | 230,918 | |||||
Goodwill | 4,016,722 | 4,016,722 | |||||
Intangible assets, net | — | 505,556 | |||||
Software development costs, net | 1,127,093 | 1,472,684 | |||||
Total assets | $ | 88,534,217 | $ | 44,752,071 | |||
Liabilities and Stockholders’ Equity | |||||||
Current liabilities: | |||||||
Accounts payable | $ | 1,372,546 | $ | 1,880,144 | |||
Accrued expenses | 2,419,917 | 1,924,973 | |||||
Contract liabilities | 10,660,068 | 7,180,264 | |||||
Current portion of notes payable | — | 1,477,139 | |||||
Total current liabilities | 14,452,531 | 12,462,520 | |||||
Finance obligation, less current portion | 34,292 | 43,808 | |||||
Notes payable, less current portion | 31,470 | 459,383 | |||||
Total liabilities | 14,518,293 | 12,965,711 | |||||
Commitments and Contingencies | — | — | |||||
Stockholders’ equity: | |||||||
Preferred stock; $.0001 par value; 10,000,000 shares authorized; no shares issued and outstanding | — | — | |||||
Common stock; $.0001 par value; 200,000,000 shares authorized; 61,809,573 and 50,050,167, respectively, issued and outstanding | 6,190 | 5,005 | |||||
Additional paid-in capital | 148,229,391 | 102,416,131 | |||||
Accumulated deficit | (74,219,657 | ) | (70,634,776 | ) | |||
Total stockholders’ equity | 74,015,924 | 31,786,360 | |||||
Total liabilities and stockholders’ equity | $ | 88,534,217 | $ | 44,752,071 | |||
IZEA Worldwide, Inc.
Consolidated Statements of Operations and Comprehensive Loss
Three Months Ended September 30, | Nine Months Ended September 30, | ||||||||||||||
2021 | 2020 | 2021 | 2020 | ||||||||||||
Revenue | $ | 7,607,546 | $ | 4,036,120 | $ | 19,521,917 | $ | 11,934,827 | |||||||
Costs and expenses: | |||||||||||||||
Cost of revenue (exclusive of amortization) | 3,975,532 | 1,701,770 | 9,664,543 | 5,256,536 | |||||||||||
Sales and marketing | 2,240,936 | 1,403,037 | 6,622,128 | 4,154,871 | |||||||||||
General and administrative | 2,670,785 | 1,827,267 | 7,865,510 | 6,165,597 | |||||||||||
Impairment of goodwill | — | — | — | 4,300,000 | |||||||||||
Depreciation and amortization | 220,453 | 372,483 | 949,906 | 1,250,859 | |||||||||||
Total costs and expenses | 9,107,706 | 5,304,557 | 25,102,087 | 21,127,863 | |||||||||||
Loss from operations | (1,500,160 | ) | (1,268,437 | ) | (5,580,170 | ) | (9,193,036 | ) | |||||||
Other income (expense): | |||||||||||||||
Interest expense | (1,558 | ) | (16,448 | ) | (24,090 | ) | (42,542 | ) | |||||||
Other income (expense), net | 20,961 | 30,085 | 2,019,379 | 26,175 | |||||||||||
Total other income (expense), net | 19,403 | 13,637 | 1,995,289 | (16,367 | ) | ||||||||||
Net loss | $ | (1,480,757 | ) | $ | (1,254,800 | ) | $ | (3,584,881 | ) | $ | (9,209,403 | ) | |||
Weighted average common shares outstanding – basic and diluted | 61,883,017 | 45,772,638 | 59,875,142 | 38,879,218 | |||||||||||
Basic and diluted loss per common share | $ | (0.02 | ) | $ | (0.03 | ) | $ | (0.06 | ) | $ | (0.24 | ) | |||
Revenue by type:
Three Months Ended September 30, | ||||||||||||||||
2021 | 2020 | $ Change | % Change | |||||||||||||
Managed Services Revenue | $ | 7,153,517 | 94 | % | $ | 3,513,806 | 87 | % | $ | 3,639,711 | 104 | % | ||||
Marketplace Spend Fees | 89,196 | 1 | % | 120,630 | 3 | % | (31,434 | ) | (26 | ) | % | |||||
License Fees | 354,850 | 5 | % | 396,549 | 10 | % | (41,699 | ) | (11 | ) | % | |||||
Other Fees | 9,983 | — | % | 5,135 | — | % | 4,848 | 94 | % | |||||||
SaaS Services Revenue | 454,029 | 6 | % | 522,314 | 13 | % | (68,285 | ) | (13 | ) | % | |||||
Total Revenue | $ | 7,607,546 | 100 | % | $ | 4,036,120 | 100 | % | $ | 3,571,426 | 88 | % | ||||
Nine Months Ended September 30, | YTD | YTD | ||||||||||||||
2021 | 2020 | $ Change | % Change | |||||||||||||
Managed Services Revenue | $ | 18,139,370 | 93 | % | $ | 10,129,210 | 85 | % | $ | 8,010,160 | 79 | % | ||||
Marketplace Spend Fees | 269,160 | 1 | % | 482,817 | 4 | % | (213,657 | ) | (44 | ) | % | |||||
License Fees | 1,082,734 | 6 | % | 1,291,002 | 11 | % | (208,268 | ) | (16 | ) | % | |||||
Other Fees | 30,653 | — | % | 31,798 | — | % | (1,145 | ) | (4 | ) | % | |||||
SaaS Services Revenue | 1,382,547 | 7 | % | 1,805,617 | 15 | % | (423,070 | ) | (23 | ) | % | |||||
Total Revenue | $ | 19,521,917 | 100 | % | $ | 11,934,827 | 100 | % | $ | 7,587,090 | 64 | % | ||||
Gross billings by revenue type:
Three Months Ended September 30, | YTD | YTD | ||||||||||||||
2021 | 2020 | $ Change | % Change | |||||||||||||
Managed Services Gross Billings | $ | 7,153,517 | 83 | % | $ | 3,513,806 | 64 | % | $ | 3,639,711 | 104 | % | ||||
Marketplace Spend Fees | 1,105,516 | 13 | % | 1,605,729 | 29 | % | (500,213 | ) | (31 | ) | % | |||||
License Fees | 354,850 | 4 | % | 396,549 | 7 | % | (41,699 | ) | (11 | ) | % | |||||
Other Fees | 9,983 | — | % | 5,135 | — | % | 4,848 | 94 | % | |||||||
SaaS Services Gross Billings | 1,470,349 | 17 | % | 2,007,413 | 36 | % | (537,064 | ) | (27 | ) | % | |||||
Total Gross Billings | $ | 8,623,866 | 100 | % | $ | 5,521,219 | 100 | % | $ | 3,102,647 | 56 | % | ||||
Nine Months Ended September 30, | YTD | YTD | ||||||||||||||
2021 | 2020 | $ Change | % Change | |||||||||||||
Managed Services Gross Billings | $ | 18,139,370 | 80 | % | $ | 10,129,210 | 63 | % | $ | 8,010,160 | 79 | % | ||||
Marketplace Spend Fees | 3,295,451 | 15 | % | 4,702,383 | 29 | % | (1,406,932 | ) | (30 | ) | % | |||||
License Fees | 1,082,734 | 5 | % | 1,291,002 | 8 | % | (208,268 | ) | (16 | ) | % | |||||
Other Fees | 30,653 | — | % | 31,798 | — | % | (1,145 | ) | (4 | ) | % | |||||
SaaS Services Gross Billings | 4,408,838 | 20 | % | 6,025,183 | 37 | % | (1,616,345 | ) | (27 | ) | % | |||||
Total Gross Billings | $ | 22,548,208 | 100 | % | $ | 16,154,393 | 100 | % | $ | 6,393,815 | 40 | % | ||||
IZEA Worldwide, Inc.
Reconciliation of GAAP Net loss to Non-GAAP Adjusted EBITDA
Three Months Ended September 30, | Nine Months Ended September 30, | ||||||||||||||
2021 | 2020 | 2021 | 2020 | ||||||||||||
Net loss | $ | (1,480,757 | ) | $ | (1,254,800 | ) | $ | (3,584,881 | ) | $ | (9,209,403 | ) | |||
Gain on the forgiveness of debt | — | — | (1,927,220 | ) | — | ||||||||||
Non-cash stock-based compensation | 229,039 | 108,568 | 633,219 | 356,846 | |||||||||||
Non-cash stock issued for payment of services | 37,544 | 31,250 | 109,784 | 93,749 | |||||||||||
Interest expense | 1,558 | 16,448 | 24,090 | 42,542 | |||||||||||
Depreciation and amortization | 220,453 | 372,483 | 949,906 | 1,250,859 | |||||||||||
Impairment of goodwill | — | — | — | 4,300,000 | |||||||||||
Other non-cash items | (13,732 | ) | 1,283 | (21,522 | ) | (22,423 | ) | ||||||||
Adjusted EBITDA | $ | (1,005,895 | ) | $ | (724,768 | ) | $ | (3,816,624 | ) | $ | (3,187,830 | ) | |||
Revenue | $ | 7,607,546 | $ | 4,036,120 | $ | 19,521,917 | $ | 11,934,827 | |||||||
Adjusted EBITDA as a % of Revenue | (13)% | (18)% | (20)% | (27)% | |||||||||||
A photo accompanying this announcement is available at https://www.globenewswire.com/NewsRoom/AttachmentNg/6cf33647-db6f-4f5d-93e6-608d9640e08d

