Will J.B. Hunt’s insurance-cost laden Q4 be taken in stride by investors?
Management from J.B. Hunt Transport Services called out cost pressures on multiple fronts several times on a Thursday evening call with investors. Insurance costs were the most notable reason for a headline miss to fourth-quarter expectations.
J.B. Hunt (NASDAQ: JBHT) reported headline earnings per share of $1.47 for the fourth quarter, which was below the consensus estimate of $1.75. However, the period included $53.4 million in incremental pre-tax charges tied to elevated premiums and the expectation of much higher per-claim payouts. Excluding the 43-cent insurance headwind, EPS would have been $1.90.
The true-up was larger during the 2022 fourth-quarter as the company recorded a $64 million charge tied to incremental reserve adjustments for prior casualty claims, which produced a 46-cent hit to that period.
“Given that the majority of motor carriers in the industry carry only $1 million in coverage, just above the legal minimum of $750,000 in coverage, it’s the larger carriers who bear the brunt or disproportionate share of the escalating insurance and claims cost,” said CEO John Roberts. “And ultimately, these inflationary costs get passed on to customers and consumers.”
Roberts said the number of claims above $1 million jumped 867% from 2010 to 2018. J.B. Hunt’s premiums resetting in 2024 have been 50% to 60% higher despite the company’s numerous safety and risk-mitigation initiatives.
The company also had a $15 million increase in losses on equipment sales during the quarter, which was a 12-cent headwind. Higher interest expense was a 3-cent detractor as net interest expense increased 46% year over year (y/y) with the company’s debt load increasing by 25% in comparison. A lower tax rate compared to last year was a 14-cent tailwind. These items were included in the $1.90 number.

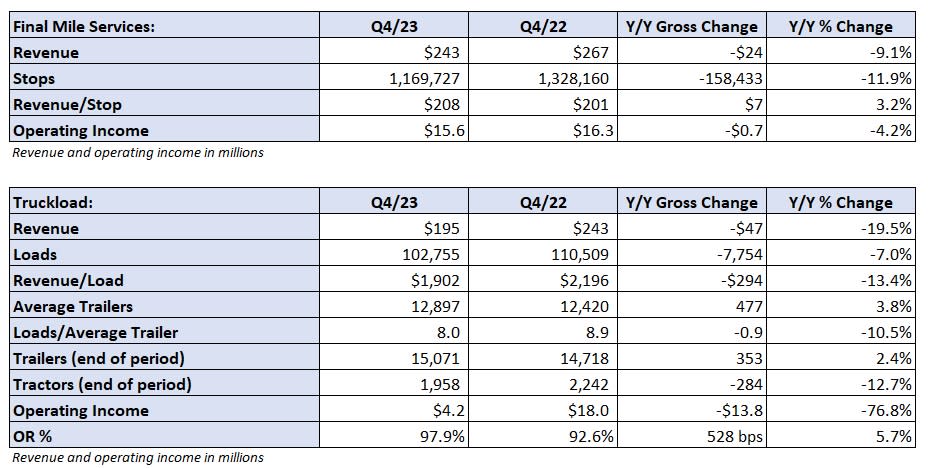
Segment results below have also been adjusted to exclude allocated incremental insurance expenses.
The inclusion or exclusion of these amounts will likely be a topic of debate among the investment community. One-off and nonrecurring items are typically excluded to produce an earnings number more reflective of ongoing operations, which is then used as the basis for valuation. However, if the current environment proves to be the new norm for insurance premiums and claims costs, the items may be included going forward.
Management said it believes the recent charges incurred to correct insurance reserves won’t likely be as severe moving forward.
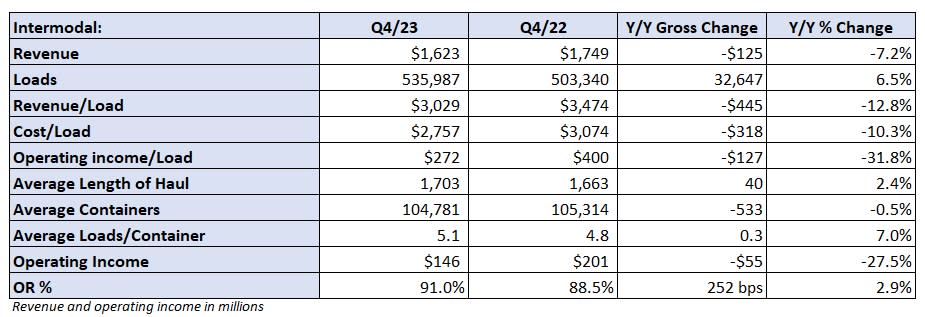
Intermodal volumes press higher
Intermodal volumes were up 6.5% y/y and 3% higher than in the third quarter, which slightly outpaced the broader industry. Intermodal traffic on the U.S. Class I railroads was up 6% y/y, according to the Association of American Railroads. By month, J.B. Hunt’s October and November volumes were up 6% y/y, with December increasing by 8%.
Revenue per load was down 13% y/y (up 2% sequentially) but cost per load fell just 10% y/y (up 1% sequentially). Revenue per load was down 10% y/y excluding fuel surcharges. The segment reported a 91% operating ratio, which was 250 basis points worse y/y but 80 bps improved from the third quarter.
Management didn’t provide any guidance for the intermodal division in the new year as forecasting from its customers remains cloudy. It noted that indications are for volumes to continue to shift to the West Coast given conflict in the Red Sea, which has diminished ocean carriers’ willingness to navigate the Suez Canal. A West Coast mix shift increases length of haul (revenue dollars) and lifts margins.
Mostly due to prior-year comps — strength in the East with weakness in the West due to a port labor dispute — J.B. Hunt’s transcontinental loads increased 13% y/y in the quarter while Eastern loads were down 2%.
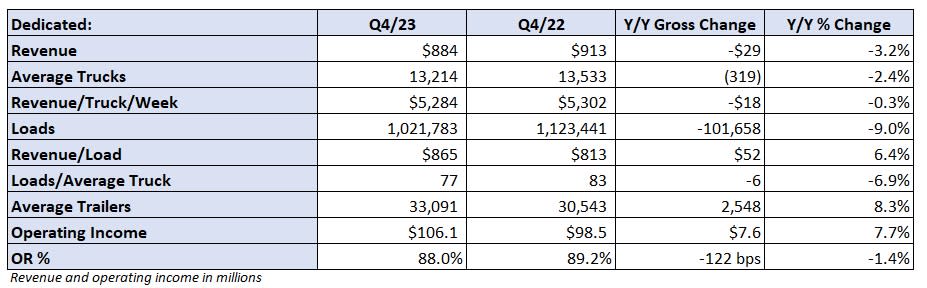
Dedicated hangs steady
Dedicated revenue fell 3% y/y as loads were off 9% and revenue per load increased 6%. Average trucks in service fell 2% and revenue per truck per week was flat (up 3% excluding fuel surcharges). The unit saw some fleet downsizing within accounts given a weaker demand environment as well as some customer attrition as J.B. Hunt remains “disciplined” on pricing.
The segment recorded an 88% OR, which was 120 bps better y/y. Maturation of previously onboarded accounts has resulted in better productivity.
The company inked contracts with customers representing 300 trucks in the quarter. It sold dedicated service on a total of 1,150 trucks during 2023.
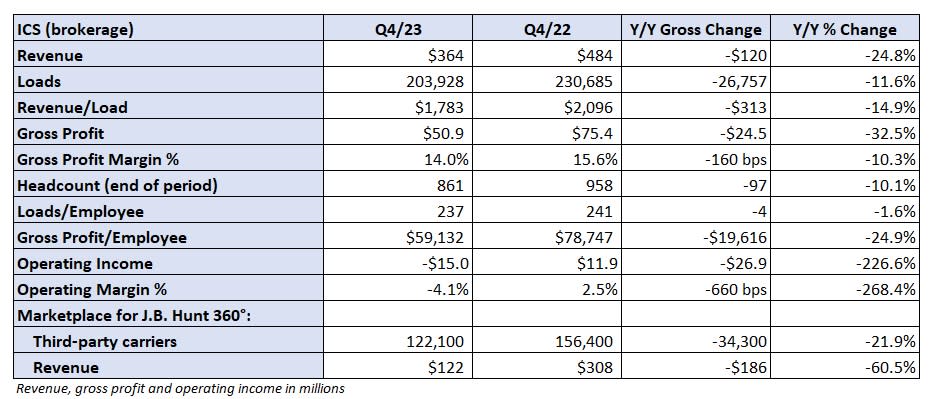
Brokerage books another loss
Integrated Capacity Solutions recorded a 25% y/y decline in revenue to $364 million as loads fell 12% and revenue per load dropped 15%. The decline included a $90 million revenue contribution from the brokerage operations of BNSF Logistics (NYSE: BRK.B), which was acquired in September.
The unit lost $15 million in the quarter compared to a profit of $12 million last year. Acquisition-related costs were likely a $5 million to $6 million drag on the period.
Shares of J.B Hunt were up 4.2% in after-hours trading Thursday evening.
“Net net we’d expect a stock reaction that is commensurate with the 3.5% underlying profit beat,” Deutsche Bank (NYSE: DB) analyst Amit Mehrotra said shortly after the earnings report was released. “Shares are already richly valued, so we don’t think we’ll get much multiple expansion, if any.”
The post Will J.B. Hunt’s insurance-cost laden Q4 be taken in stride by investors? appeared first on FreightWaves.
