James Hardie Industries plc's (ASX:JHX) Stock Has Been Sliding But Fundamentals Look Strong: Is The Market Wrong?
James Hardie Industries (ASX:JHX) has had a rough three months with its share price down 11%. However, a closer look at its sound financials might cause you to think again. Given that fundamentals usually drive long-term market outcomes, the company is worth looking at. Specifically, we decided to study James Hardie Industries' ROE in this article.
Return on equity or ROE is an important factor to be considered by a shareholder because it tells them how effectively their capital is being reinvested. In simpler terms, it measures the profitability of a company in relation to shareholder's equity.
View our latest analysis for James Hardie Industries
How Do You Calculate Return On Equity?
Return on equity can be calculated by using the formula:
Return on Equity = Net Profit (from continuing operations) ÷ Shareholders' Equity
So, based on the above formula, the ROE for James Hardie Industries is:
29% = US$507m ÷ US$1.7b (Based on the trailing twelve months to June 2023).
The 'return' refers to a company's earnings over the last year. That means that for every A$1 worth of shareholders' equity, the company generated A$0.29 in profit.
What Is The Relationship Between ROE And Earnings Growth?
We have already established that ROE serves as an efficient profit-generating gauge for a company's future earnings. Based on how much of its profits the company chooses to reinvest or "retain", we are then able to evaluate a company's future ability to generate profits. Assuming everything else remains unchanged, the higher the ROE and profit retention, the higher the growth rate of a company compared to companies that don't necessarily bear these characteristics.
James Hardie Industries' Earnings Growth And 29% ROE
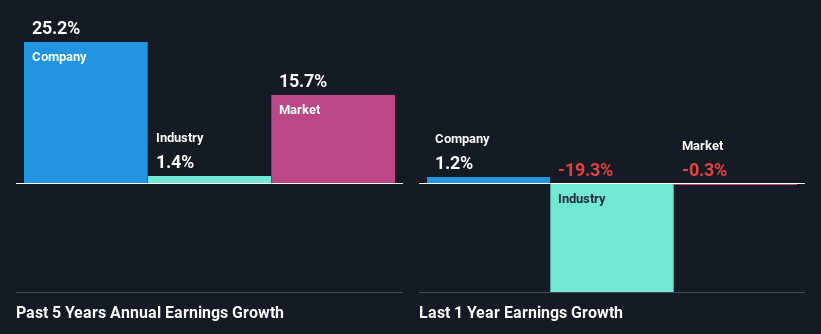
To begin with, James Hardie Industries has a pretty high ROE which is interesting. Additionally, the company's ROE is higher compared to the industry average of 9.6% which is quite remarkable. Under the circumstances, James Hardie Industries' considerable five year net income growth of 25% was to be expected.
We then compared James Hardie Industries' net income growth with the industry and we're pleased to see that the company's growth figure is higher when compared with the industry which has a growth rate of 1.4% in the same 5-year period.
The basis for attaching value to a company is, to a great extent, tied to its earnings growth. It’s important for an investor to know whether the market has priced in the company's expected earnings growth (or decline). This then helps them determine if the stock is placed for a bright or bleak future. What is JHX worth today? The intrinsic value infographic in our free research report helps visualize whether JHX is currently mispriced by the market.
Is James Hardie Industries Efficiently Re-investing Its Profits?
While the company did pay out a portion of its dividend in the past, it currently doesn't pay a dividend. This is likely what's driving the high earnings growth number discussed above.
Existing analyst estimates suggest that the company's future payout ratio is expected to drop to 14% over the next three years. Regardless, the ROE is not expected to change much for the company despite the lower expected payout ratio.
Conclusion
Overall, we are quite pleased with James Hardie Industries' performance. In particular, it's great to see that the company is investing heavily into its business and along with a high rate of return, that has resulted in a sizeable growth in its earnings. Having said that, the company's earnings growth is expected to slow down, as forecasted in the current analyst estimates. To know more about the company's future earnings growth forecasts take a look at this free report on analyst forecasts for the company to find out more.
Have feedback on this article? Concerned about the content? Get in touch with us directly. Alternatively, email editorial-team (at) simplywallst.com.
This article by Simply Wall St is general in nature. We provide commentary based on historical data and analyst forecasts only using an unbiased methodology and our articles are not intended to be financial advice. It does not constitute a recommendation to buy or sell any stock, and does not take account of your objectives, or your financial situation. We aim to bring you long-term focused analysis driven by fundamental data. Note that our analysis may not factor in the latest price-sensitive company announcements or qualitative material. Simply Wall St has no position in any stocks mentioned.
