Japanese Stocks Are Hopping Higher
This article was originally published on ETFTrends.com.
By Jeff Weniger, CFA, Head of Equity Strategy
It’s not only artificial intelligence companies that are catching a bid in 2023. While there has been much discussion over the market’s narrow breadth, which has come in the form of a handful of mega caps single-handedly propping up the S&P 500 Index this year, many overseas exchanges have been teeming with vitality.
One of those markets is Japan, which had been out of favor since the end of its stock market’s ruthless run higher in the early days of Abenomics a decade ago. After that, don’t ask; we spent many years with scant inquiries about the once-mighty WisdomTree Japan Hedged Equity Fund (DXJ).
We often quip that “no one” is bullish Japan and “no one” is bearish, because “no one” even gives the country enough thought to form an opinion.
Even now, in our U.S.-centric Wall Street press, what do we see? A full court press on artificial intelligence.
There is, right now, contentious corporate action with regard to the competence of the management team at Toyota, yet good luck finding a journalist in London or New York who cares to write it up. But seek out a piece on Tesla and you will be showered with headlines.
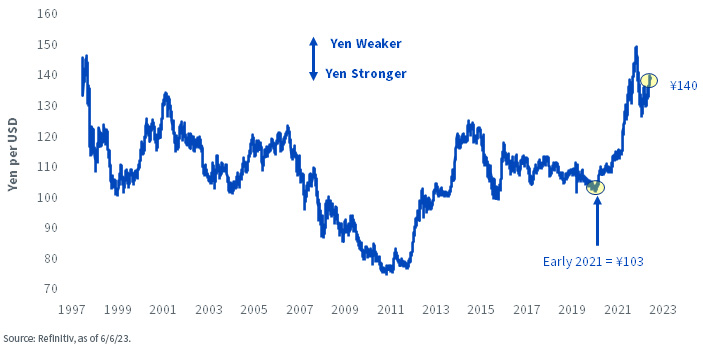
DXJ is kicking higher, with a renewed stream of creations in the last few months, on account of its 17.4% year-to-date pop. The momentum places it ahead of both the MSCI Japan Index (+8.6%) and the S&P 500 (+10.3%).1 A contributing factor to this recent success is the yen’s weakened state; it has depreciated from ¥103 per dollar in early 2021 to ¥139 currently (figure 1). Being currency-hedged and exporter-tilted, DXJ loved this action.
Figure 1: JPY per USD
I’ve spilled no shortage of ink on the “TINA” concept, which states that much of the justification for the latter stages of the S&P 500’s 2009–2021 bull run was predicated on the idea that “There Is No Alternative” to owning stocks—even at inflated valuations, when bond markets the world over were paying zero or negative yields.
Over the past five quarters, central banks, including the Federal Reserve, have been ratcheting money market rates higher. The sharp ascent in interest rates has been ubiquitous, with a notable exception—Japan.
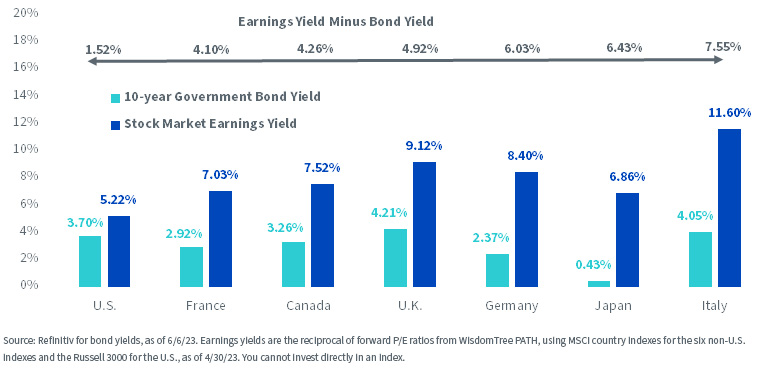
The earnings yield of the MSCI Japan Index, the reciprocal of its forward P/E, stands at 6.86%, surpassing the yield on 10-year Japanese government bonds (JGBs) by 643 basis points (bps). Inside the G7 economies, that gap is only exceeded by Italy, whose spread between an 11.6% earnings yield and a 4.05% bond yield is 755 bps. When juxtaposed against the narrow 152 bps spread that prevails in the U.S., the Japanese bull case rests in part on a margin of safety argument.
Figure 2: A Wide Dispersion in G7 Economies’ Earnings Yields vs. Bond Yields
Japan Needs Catalysts
In the U.S., both the public and Washington are out for blood when it comes to buybacks. The implementation of the 1% buyback tax was cheered, not jeered, and the Biden administration has on many occasions called for it to be hiked to 4%. What a sharp contrast to the lay of the land in Japan, where officialdom is practically begging companies to use generally abundant cash for buybacks.
Japan’s cash hoard, earning zero percent interest, is the drag. Compare short-term cash proxies—current assets and liabilities—and it is clear how different Japan’s balance sheets are from American ones.
A few considerations, some positive, some negative, with regard to the cash:
Having it is a dream in a liquidity crisis; but if crises fail to materialize, cash is an anvil
Maybe we catch some shareholder friendliness in the form of buyback and/or dividend boosts
Perhaps a wave of buybacks is just a dream, yet another dashed hope in the frustrating saga of Japanese equities since 1989’s bubble burst
Meantime, figure 3 shows the interaction between current assets and current liabilities. This chart may be for the reader with the mindset that SVB and Signature Bank were the canaries.
Figure 3: U.S. vs. Japan: Distribution of Stocks by Current Ratio (Current Assets Divided by Current Liabilities)
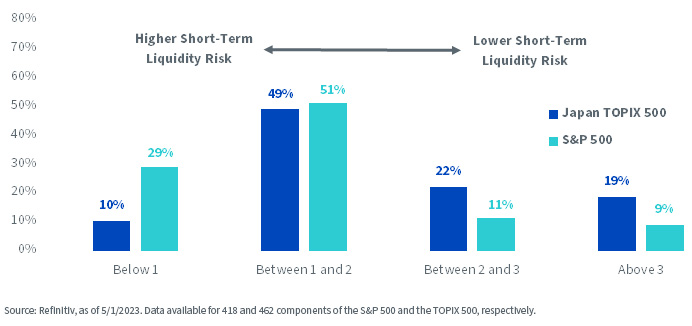
Figure 4 has become a WisdomTree favorite because price-to-book (P/B) is specifically critical right now in Japanese equity market calculus. The reason: the Tokyo Stock Exchange is demanding companies with P/B ratios below 1.0 take action to boost their valuations, under penalty of de-listing if they cannot pull it off.
Figure 4: Percentage of Index Constituents with Price-to-Book Ratios under 1
We count 52% of the companies in DXJ’s underlying Index that fit that sub-1 P/B bill. I asked my colleague Jeremy Schwartz about it. He says some early reports estimate that one-third of companies with P/B ratios below 1 are already taking action to conduct buybacks and/or increase dividends.
There are a few other catalysts, some big, some small:
Little things could be changing. For example, Japan somehow made it all the way to 2023 with some companies still not publishing financials in English. This is the type of silly rigidity that is ‘low-hanging fruit’ for international capital, if it changes. Whether this type of thing gets rectified—and there is a push for it from on high—we don’t know. But it’s this stuff that makes Japan so quirky.
Another bullish portent for the country is a classic appeal to authority, the psychological heuristic. Warren Buffett splashed the headlines this spring with news that Berkshire increased its stakes in the Japanese trading houses that were accumulated a few years back. Because buying them is a long-yen action, Berkshire issued JPY debt to neutralize exposure to the yen. We quip that, in so doing, Buffett “did a synthetic DXJ.”
Japan is also benefiting from geopolitical tension with China, functioning as the primary U.S. ally in the region and as a hub for Asian business. It is serving as a developed market backdoor China play, as many firms’ business models rely on selling into it.
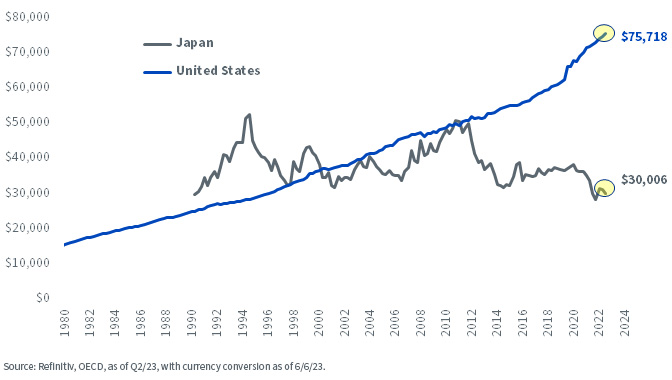
Finally, my favorite chart, one of the most underrated concepts in macro right now. As weak as wage boosts have been in the U.S. over the years, at least workers did see them go up. But in Japan, wages have gone sideways every year for as long as most of us can remember. Add in the effect of the yen’s weakening from ¥78 after the global financial crisis to ¥140 today and the set-up is clear: wage arbitrage.
About a generation ago, wages in Japan and the U.S. were largely equivalent in U.S. dollar terms. No more. The average Japanese worker makes about $30,000 when JPY is converted to USD. It is a far cry from Americans, who make $75,718 on average (figure 5).
Figure 5: Average Annual Wage Growth (USD)
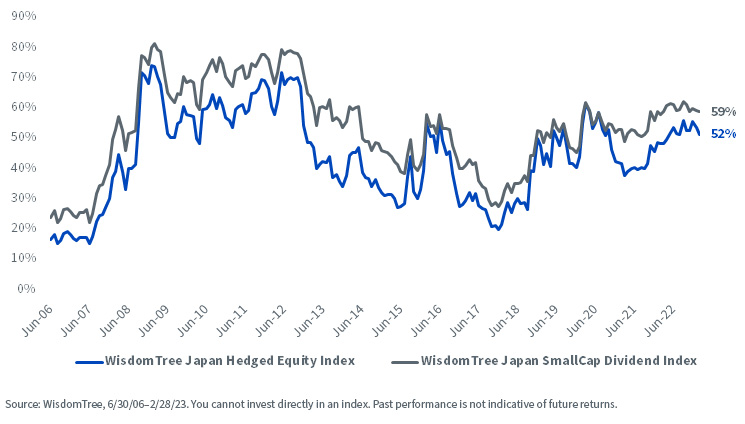
DXJ’s fact sheet can be found here. A similar one is DXJS, the WisdomTree Japan Hedged SmallCap Equity Fund. That one is also currency hedged, with a fact sheet here. For Japan exposure without the currency hedge, DFJ is the WisdomTree Japan SmallCap Dividend Fund. Its fact sheet is here.
Originally published 16 June 2023.
For more news, information, and analysis, visit the Modern Alpha Channel.
1 The performance data quoted represents past performance and is no guarantee of future results. Investment return and principal value of an investment will fluctuate so that an investor's shares, when redeemed, may be worth more or less than their original cost. Current performance may be lower or higher than the performance data quoted. For the most recent month-end and standardized performance, SEC standardized yield, and Fund holdings, click here.
Important Risks Related to this Article
There are risks associated with investing, including the possible loss of principal. Foreign investing involves special risks, such as risk of loss from currency fluctuation or political or economic uncertainty. The Fund focuses its investments in Japan, thereby increasing the impact of events and developments in Japan that can adversely affect performance. Investments in currency involve additional special risks, such as credit risk, interest rate fluctuations, and derivative investments, which can be volatile and may be less liquid than other securities, and more sensitive to the effect of varied economic conditions. As this Fund can have a high concentration in some issuers, the Fund can be adversely impacted by changes affecting those issuers. Due to the investment strategy of this Fund it may make higher capital gain distributions than other ETFs. Dividends are not guaranteed, and a company currently paying dividends may cease paying dividends at any time. Please read the Fund’s prospectus for specific details regarding the Fund’s risk profile.
POPULAR ARTICLES AND RESOURCES FROM ETFTRENDS.COM
