Japanese Yen Bounce Might Start Larger Correction
Article Summary: Important signs of turnaround in the Japanese Yen have led our sentiment-based systems to sell the USDJPY and GBPJPY. View our article and recorded webinar to see why we like these trades.
DailyFX PLUS System Trading Signals – A noteworthy reversal in the Japanese Yen suggests the “easiest” part of the JPY breakdown may be over, but elevated forex options market volatility expectations continue to favor breakout trading until further notice. In fact our sentiment-based Breakout2 strategy has now gone long the Japanese Yen against the US Dollar, British Pound, and Australian Dollar (short USDJPY, GBPJPY, and AUDJPY).
Trading the Yen breakdown has been quite beneficial for us and we hesitate to switch directions so rapidly. Yet cyclical studies suggest that EURJPY’s turn on Friday may have marked a significant turn in the trend. Extremely high volatility expectations for the JPY suggest Breakout2 may continue doing well.
You can view a more full explanation of our reasons behind JPY long positions in today’s archived strategy webinar.
DailyFX Forex Volatility Index Versus JPY Volatility Index (JPYVIX1M)

Source: OTC FX Options Prices, DailyFX Calculations
A look at FX options market volatility expectations emphasizes that markets are moving in two speeds at the moment. Japanese Yen currency pairs may continue to see big moves, while US Dollar pairs are expected to consolidate or move much more slowly in the days and weeks ahead.
Past performance is absolutely NOT indicative of future results, but high volatility expectations on JPY pairs tends to coincide with outperformance in our Breakout-based strategy. Elsewhere we’ve seen our Momentum2 system do well across the EURUSD and others—we favor playing the ‘hot hand’ until further notice.
I don’t want you to take my word for it—participate in our promo and get these strategies to test yourself.
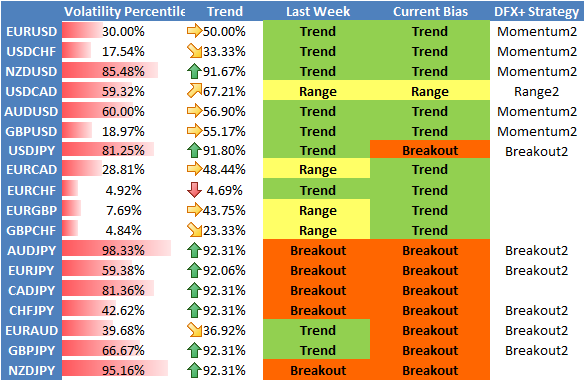
View the table below to see our strategy preferences broken down by currency pair.
DailyFX Individual Currency Pair Conditions and Trading Strategy Bias

View how to automate the high-volatility Breakout2 Trading System via our previous article and webinar recording.
Auto trade the trend reversal-trading Momentum2system via our previous article and webinar recording.
Trade with strong trends via our Momentum1 Trading System and view an archived webinar
Use our counter-trend Range2 Trading system and view an archived webinar guide on automation
--- Written by David Rodriguez, Quantitative Strategist for DailyFX.com
To receive the Speculative Sentiment Index and other reports from this author via e-mail, sign up to David’s e-mail distribution list via this link.
Contact David via
Twitter at http://www.twitter.com/DRodriguezFX
Facebook at http://www.Facebook.com/DRodriguezFX
New to forex? Sign up for our DailyFX Forex Education Series
Definitions
Volatility Percentile – The higher the number, the more likely we are to see strong movements in price. This number tells us where current implied volatility levels stand in relation to the past 90 days of trading. We have found that implied volatilities tend to remain very high or very low for extended periods of time. As such, it is helpful to know where the current implied volatility level stands in relation to its medium-term range.
Trend – This indicator measures trend intensity by telling us where price stands in relation to its 90 trading-day range. A very low number tells us that price is currently at or near 90-day lows, while a higher number tells us that we are near the highs. A value at or near 50 percent tells us that we are at the middle of the currency pair’s 90-day range.
Range High – 90-day closing high.
Range Low – 90-day closing low.
Last – Current market price.
Bias – Based on the above criteria, we assign the more likely profitable strategy for any given currency pair. A highly volatile currency pair (Volatility Percentile very high) suggests that we should look to use Breakout strategies. More moderate volatility levels and strong Trend values make Momentum trades more attractive, while the lowest Vol Percentile and Trend indicator figures make Range Trading the more attractive strategy.
HYPOTHETICAL PERFORMANCE RESULTS HAVE MANY INHERENT LIMITATIONS, SOME OF WHICH ARE DESCRIBED BELOW. NO REPRESENTATION IS BEING MADE THAT ANY ACCOUNT WILL OR IS LIKELY TO ACHIEVE PROFITS OR LOSSES SIMILAR TO THOSE SHOWN. IN FACT, THERE ARE FREQUENTLY SHARP DIFFERENCES BETWEEN HYPOTHETICAL PERFORMANCE RESULTS AND THE ACTUAL RESULTS SUBSEQUENTLY ACHIEVED BY ANY PARTICULAR TRADING PROGRAM.
ONE OF THE LIMITATIONS OF HYPOTHETICAL PERFORMANCE RESULTS IS THAT THEY ARE GENERALLY PREPARED WITH THE BENEFIT OF HINDSIGHT. IN ADDITION, HYPOTHETICAL TRADING DOES NOT INVOLVE FINANCIAL RISK, AND NO HYPOTHETICAL TRADING RECORD CAN COMPLETELY ACCOUNT FOR THE IMPACT OF FINANCIAL RISK IN ACTUAL TRADING. FOR EXAMPLE, THE ABILITY TO WITHSTAND LOSSES OR TO ADHERE TO A PARTICULAR TRADING PROGRAM IN SPITE OF TRADING LOSSES IS MATERIAL POINTS WHICH CAN ALSO ADVERSELY AFFECT ACTUAL TRADING RESULTS. THERE ARE NUMEROUS OTHER FACTORS RELATED TO THE MARKETS IN GENERAL OR TO THE IMPLEMENTATION.
OF ANY SPECIFIC TRADING PROGRAM WHICH CANNOT BE FULLY ACCOUNTED FOR IN THE PREPARATION OF HYPOTHETICAL PERFORMANCE RESULTS AND ALL OF WHICH CAN ADVERSELY AFFECT ACTUAL TRADING RESULTS. Any opinions, news, research, analyses, prices, or other information contained on this website is provided as general market commentary, and does not constitute investment advice. The FXCM group will not accept liability for any loss or damage, including without limitation to, any loss of profit, which may arise directly or indirectly from use of or reliance contained in the trading signals, or in any accompanying chart analyses.
DailyFX provides forex news and technical analysis on the trends that influence the global currency markets.
Learn forex trading with a free practice account and trading charts from FXCM.
