JetBlue Airways Corporation’s (NASDAQ:JBLU) Investment Returns Are Lagging Its Industry

Want to participate in a short research study? Help shape the future of investing tools and you could win a $250 gift card!
Today we’ll evaluate JetBlue Airways Corporation (NASDAQ:JBLU) to determine whether it could have potential as an investment idea. To be precise, we’ll consider its Return On Capital Employed (ROCE), as that will inform our view of the quality of the business.
First, we’ll go over how we calculate ROCE. Then we’ll compare its ROCE to similar companies. Last but not least, we’ll look at what impact its current liabilities have on its ROCE.
Understanding Return On Capital Employed (ROCE)
ROCE is a metric for evaluating how much pre-tax income (in percentage terms) a company earns on the capital invested in its business. In general, businesses with a higher ROCE are usually better quality. In brief, it is a useful tool, but it is not without drawbacks. Renowned investment researcher Michael Mauboussin has suggested that a high ROCE can indicate that ‘one dollar invested in the company generates value of more than one dollar’.
How Do You Calculate Return On Capital Employed?
The formula for calculating the return on capital employed is:
Return on Capital Employed = Earnings Before Interest and Tax (EBIT) ÷ (Total Assets – Current Liabilities)
Or for JetBlue Airways:
0.095 = US$723m ÷ (US$10b – US$2.5b) (Based on the trailing twelve months to December 2018.)
Therefore, JetBlue Airways has an ROCE of 9.5%.
Check out our latest analysis for JetBlue Airways
Does JetBlue Airways Have A Good ROCE?
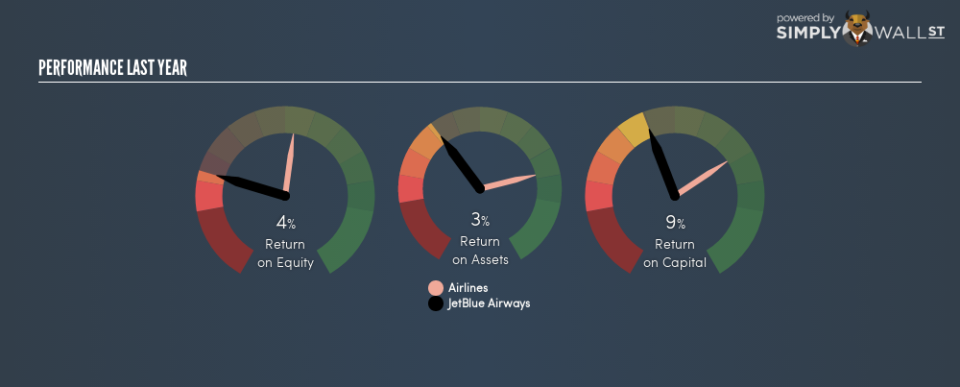
ROCE can be useful when making comparisons, such as between similar companies. Using our data, JetBlue Airways’s ROCE appears to be significantly below the 12% average in the Airlines industry. This performance is not ideal, as it suggests the company may not be deploying its capital as effectively as some competitors. Setting aside the industry comparison for now, JetBlue Airways’s ROCE is mediocre in absolute terms, considering the risk of investing in stocks versus the safety of a bank account. Readers may find more attractive investment prospects elsewhere.
As we can see, JetBlue Airways currently has an ROCE of 9.5%, less than the 19% it reported 3 years ago. This makes us wonder if the business is facing new challenges.
Remember that this metric is backwards looking – it shows what has happened in the past, and does not accurately predict the future. Companies in cyclical industries can be difficult to understand using ROCE, as returns typically look high during boom times, and low during busts. ROCE is, after all, simply a snap shot of a single year. Since the future is so important for investors, you should check out our free report on analyst forecasts for JetBlue Airways.
JetBlue Airways’s Current Liabilities And Their Impact On Its ROCE
Liabilities, such as supplier bills and bank overdrafts, are referred to as current liabilities if they need to be paid within 12 months. Due to the way ROCE is calculated, a high level of current liabilities makes a company look as though it has less capital employed, and thus can (sometimes unfairly) boost the ROCE. To counter this, investors can check if a company has high current liabilities relative to total assets.
JetBlue Airways has total liabilities of US$2.5b and total assets of US$10b. As a result, its current liabilities are equal to approximately 25% of its total assets. This very reasonable level of current liabilities would not boost the ROCE by much.
The Bottom Line On JetBlue Airways’s ROCE
If JetBlue Airways continues to earn an uninspiring ROCE, there may be better places to invest. You might be able to find a better buy than JetBlue Airways. If you want a selection of possible winners, check out this free list of interesting companies that trade on a P/E below 20 (but have proven they can grow earnings).
If you like to buy stocks alongside management, then you might just love this free list of companies. (Hint: insiders have been buying them).
To help readers see past the short term volatility of the financial market, we aim to bring you a long-term focused research analysis purely driven by fundamental data. Note that our analysis does not factor in the latest price-sensitive company announcements.
The author is an independent contributor and at the time of publication had no position in the stocks mentioned. For errors that warrant correction please contact the editor at editorial-team@simplywallst.com.
