JetBlue (JBLU) Q2 Earnings & Revenues Top Estimates, Up Y/Y
JetBlue Airways JBLU reported better-than-expected earnings and revenues in the second quarter of 2019. The company’s bottom line (excluding 1 cent from non-recurring items) came in at 60 cents per share, which outpaced the Zacks Consensus Estimate of 57 cents. Moreover, quarterly earnings increased 57.9% on a year-over-year basis due to its prudent cost management.
Operating revenues totaled $2,105 million, which surpassed the Zacks Consensus Estimate of $2,100.3 million. Moreover, it compared favorably with the year-ago number. Passenger revenues, which accounted for bulk of the top line (96.5%), improved 9.3% in the quarter under review. Other revenues were up 5.3%.
Additionally, this low-cost carrier issued performed well with respect to revenue per available seat mile (RASM: a key measure of unit revenue) in the reported quarter. RASM increased 3.1% in the reported quarter to 13.14 cents. RASM was aided by the holiday calendar placement apart from strong close-in trends.
Capacity, measured in available seat miles, expanded 5.9% year over year. Meanwhile, traffic, measured in revenue passenger miles, grew 5.7% in the reported quarter. Consolidated load factor (percentage of seats filled by passengers) contracted 20 basis points year over year to 86% as traffic growth was outpaced by capacity expansion in the three-month period.
Average fare at JetBlue during the quarter increased 8.3% to $184.24. Yield per passenger mile increased 3.5% year over year to 14.74 cents. Passenger revenue per available seat mile (PRASM) increased 3.3% to 12.68 cents.
In the second quarter, total operating expenses (on a reported basis) declined 10.8% year over year despite higher costs pertaining to salaries, wages and benefits. Average fuel cost per gallon (including fuel taxes) decreased 5.5% year over year to $2.16.
JetBlue’s operating expenses per available seat mile (CASM) declined 15.7% to 11.58 cents. Excluding fuel, the metric increased 1.8% to 8.46 cents mainly due to pilot contract costs
JetBlue, sporting a Zacks Rank #1 (Strong Buy), exited the quarter with cash and cash equivalents of $461 million compared with $474 million at the end of 2018. Total debt at the end of the second quarter was $1,492 million compared with $1, 670 million at the end of 2018.
You can see the complete list of today’s Zacks #1 Rank stocks here.
JetBlue Airways Corporation Price, Consensus and EPS Surprise
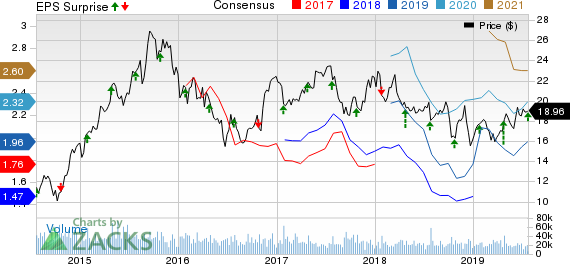
JetBlue Airways Corporation price-consensus-eps-surprise-chart | JetBlue Airways Corporation Quote
Outlook
For the third quarter of 2019, JetBlue expects RASM to grow between 0.5% and 3.5% year over year. For the third quarter, the carrier expects capacity to increase between 3% and 5%. The metric is anticipated to improve in the range of 5.5-6.5% for full-year 2019.
Consolidated operating cost per available seat mile, excluding fuel, is expected to increase 0.5-2.5% in the third quarter. For the current year, the metric is projected to increase between 0.5% and 1.5%. The company expects effective tax rate of 26% for full-year 2019.
Third-quarter fuel cost, net of hedges, is anticipated to be $2.18 per gallon. The company is well on track to achieve its 2020 EPS target, which is in the $2.5-$3 range. The Zacks Consensus Estimate for 2020 earnings is currently pegged at $2.32.
Total capital expenditures for the third quarter are expected between $285 million and $350 million. The metric is anticipated in the range of $1200-$1,350 million for full-year 2019.
Upcoming Releases
Investors interested in the Zacks Airline industry are keenly awaiting second-quarter 2019 earnings reports from key players like Southwest Airlines LUV, Alaska Air Group ALK and American Airlines AAL. All three carriers are scheduled to report on Jul 25.
Today's Best Stocks from Zacks
Would you like to see the updated picks from our best market-beating strategies? From 2017 through 2018, while the S&P 500 gained +15.8%, five of our screens returned +38.0%, +61.3%, +61.6%, +68.1% and +98.3%.
This outperformance has not just been a recent phenomenon. From 2000 – 2018, while the S&P averaged +4.8% per year, our top strategies averaged up to +56.2% per year.
See their latest picks free >>
Want the latest recommendations from Zacks Investment Research? Today, you can download 7 Best Stocks for the Next 30 Days. Click to get this free report
Alaska Air Group, Inc. (ALK) : Free Stock Analysis Report
JetBlue Airways Corporation (JBLU) : Free Stock Analysis Report
Southwest Airlines Co. (LUV) : Free Stock Analysis Report
American Airlines Group Inc. (AAL) : Free Stock Analysis Report
To read this article on Zacks.com click here.
Zacks Investment Research
