Jiayin Group Inc. Reports Third Quarter 2023 Unaudited Financial Results

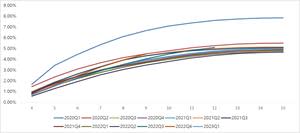
M3+ Delinquency Rate by Vintage
-- Third Quarter Total Loan Origination Volume Grew 62.4% to RMB24.2 billion --
-- Third Quarter Net Revenue Grew 64.0% to RMB 1,466.3 million --
-- Third Quarter Net Income Grew 30.6% to RMB 323.9 million --
SHANGHAI, China, Nov. 22, 2023 (GLOBE NEWSWIRE) -- Jiayin Group Inc. (“Jiayin” or the “Company”) (NASDAQ: JFIN), a leading fintech platform in China, today announced its unaudited financial results for the third quarter ended September 30, 2023.
Third Quarter 2023 Operational and Financial Highlights:
Loan origination volume1 was RMB24.2 billion (US$3.3 billion), representing an increase of 62.4% from the same period of 2022.
Average borrowing amount per borrowing was RMB10,972 (US$1,504), representing an increase of 8.0% from the same period of 2022.
Repeat borrowing rate2 increased to 71.5% from 63.8% in the same period of 2022.
Net revenue was RMB1,466.3 million (US$201.0 million), representing an increase of 64.0% from the same period of 2022.
Income from operations was RMB381.9 million (US$52.3 million), representing an increase of 23.8% from the same period of 2022.
Net income was RMB323.9 million (US$44.4 million), representing an increase of 30.6% from the same period of 2022.
Mr. Yan Dinggui, the Company’s Founder, Director and Chief Executive Officer, commented: “This quarter, we have achieved new milestones in our key financial and operational metrics. Our loan origination volume reached RMB 24.2 billion in the third quarter, a 62.4% increase compared to the same period last year. Net revenue grew by 64.0%, while net profit further solidified to RMB 323.9 million. These results once again prove that our development path is healthy and sustainable, and our strategy is precise and practical. With the approval of the Company’s board of directors, we are pleased to announce the plan for the second tranche of dividends. We are confident and capable of continuously creating value for our investors and growing into a significant player in the global fin-tech industry.”
Third Quarter 2023 Financial Results
Net revenue was RMB1,466.3 million (US$201.0 million), representing an increase of 64.0% from the same period of 2022.
Revenue from loan facilitation services was RMB936.5 million (US$128.4 million), representing an increase of 18.1% from the same period of 2022. The increase was primarily due to increased loan origination volume from the Company’s institutional funding partners.
Other revenue was RMB529.8 million (US$72.6 million), compared with RMB101.4 million for the same period of 2022. The increase was mainly driven by the growth in guarantee income from financial guarantee services.
Origination and servicing expense was RMB544.3 million (US$74.6 million), compared with RMB148.4 million for the same period of 2022, primarily due to increased loan origination volume and expenses related to financial guarantee services.
Allowance for uncollectible receivables, contract assets, loans receivable and others was RMB8.5 million (US$1.2 million), representing an increase of 44.1% from the same period of 2022, primarily due to the increased loan volume from overseas markets.
Sales and marketing expense was RMB407.9 million (US$55.9 million), representing an increase of 26.1% from the same period of 2022, primarily due to an increase in borrower acquisition expenses.
General and administrative expense was RMB53.2 million (US$7.3 million), representing an increase of 3.5% from the same period of 2022, primarily driven by an increase in expenditures for employee compensation and related benefits.
Research and development expense was RMB70.5 million (US$9.7 million), representing an increase of 25.0% from the same period of 2022, primarily due to the higher employee compensation as a result of an increase in research and development department headcount.
Income from operations was RMB381.9 million (US$52.3 million), representing an increase of 23.8% from the same period of 2022.
Net income was RMB323.9 million (US$44.4 million), representing an increase of 30.6% from RMB248.1 million in the same period of 2022.
Basic and diluted net income per share were both RMB1.51 (US$0.21), compared to RMB1.15 in the third quarter of 2022. Basic and diluted net income per ADS were both RMB6.03 (US$0.83), compared to RMB4.60 in the third quarter of 2022. Each ADS represents four Class A ordinary shares of the Company.
Cash and cash equivalents were RMB180.3 million (US$24.7 million) as of September 30, 2023, compared with RMB288.9 million as of June 30, 2023.
The following table provides the delinquency rates of all outstanding loans on the Company’s platform in Mainland China as of the respective dates indicated.
|
| Delinquent for | ||||
As of |
| 1-30 days | 31-60 days | 61-90 days | 91 -180 days | More than 180 days |
|
| (%) | ||||
December 31, 2020 |
| 1.47 | 0.88 | 0.70 | 1.66 | 1.81 |
December 31, 2021 |
| 1.31 | 0.90 | 0.72 | 1.78 | 2.12 |
December 31, 2022 |
| 1.01 | 0.67 | 0.51 | 1.18 | 2.02 |
March 31, 2023 |
| 0.91 | 0.79 | 0.63 | 1.40 | 1.72 |
June 30, 2023 |
| 0.97 | 0.70 | 0.66 | 1.45 | 1.76 |
September 30, 2023 |
| 1.16 | 0.76 | 0.52 | 1.29 | 2.02 |
|
|
|
|
|
|
|
The following chart and table display the historical cumulative M3+ Delinquency Rate by Vintage for loan products facilitated through the Company’s platform in Mainland China.
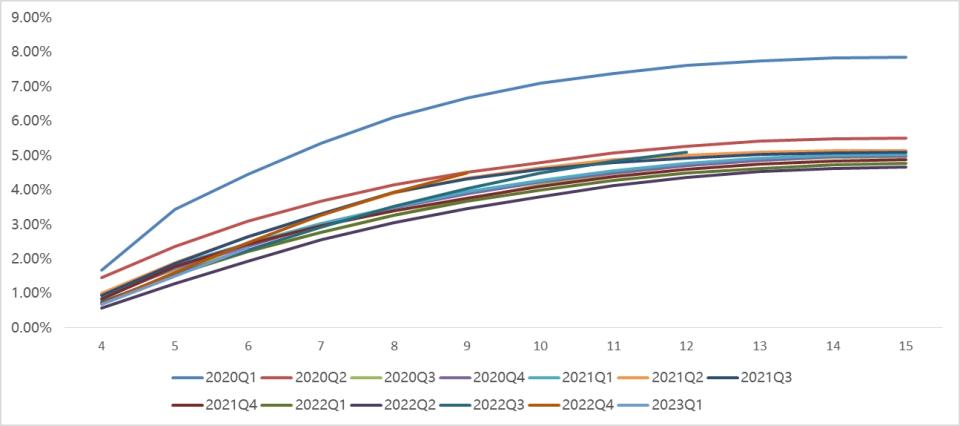
| Month on Book | |||||||||||||||||||||||
Vintage | 4th | 5th | 6th | 7th | 8th | 9th | 10th | 11th | 12th | 13th | 14th | 15th | ||||||||||||
2020Q1 | 1.67 | % | 3.43 | % | 4.46 | % | 5.36 | % | 6.11 | % | 6.67 | % | 7.09 | % | 7.38 | % | 7.61 | % | 7.76 | % | 7.84 | % | 7.85 | % |
2020Q2 | 1.46 | % | 2.37 | % | 3.11 | % | 3.68 | % | 4.14 | % | 4.52 | % | 4.80 | % | 5.08 | % | 5.27 | % | 5.42 | % | 5.49 | % | 5.51 | % |
2020Q3 | 0.96 | % | 1.70 | % | 2.24 | % | 2.77 | % | 3.27 | % | 3.73 | % | 4.16 | % | 4.47 | % | 4.71 | % | 4.87 | % | 4.96 | % | 4.98 | % |
2020Q4 | 0.85 | % | 1.74 | % | 2.37 | % | 3.00 | % | 3.49 | % | 3.89 | % | 4.24 | % | 4.50 | % | 4.72 | % | 4.87 | % | 4.96 | % | 4.99 | % |
2021Q1 | 0.96 | % | 1.83 | % | 2.45 | % | 3.04 | % | 3.51 | % | 3.95 | % | 4.28 | % | 4.56 | % | 4.78 | % | 4.93 | % | 5.01 | % | 5.03 | % |
2021Q2 | 1.00 | % | 1.90 | % | 2.65 | % | 3.30 | % | 3.90 | % | 4.35 | % | 4.64 | % | 4.89 | % | 5.01 | % | 5.10 | % | 5.14 | % | 5.15 | % |
2021Q3 | 0.95 | % | 1.86 | % | 2.65 | % | 3.31 | % | 3.94 | % | 4.33 | % | 4.60 | % | 4.79 | % | 4.93 | % | 5.02 | % | 5.08 | % | 5.10 | % |
2021Q4 | 0.84 | % | 1.78 | % | 2.43 | % | 2.97 | % | 3.40 | % | 3.77 | % | 4.12 | % | 4.39 | % | 4.61 | % | 4.76 | % | 4.85 | % | 4.88 | % |
2022Q1 | 0.74 | % | 1.54 | % | 2.21 | % | 2.77 | % | 3.26 | % | 3.69 | % | 4.01 | % | 4.28 | % | 4.49 | % | 4.63 | % | 4.74 | % | 4.78 | % |
2022Q2 | 0.59 | % | 1.30 | % | 1.94 | % | 2.56 | % | 3.06 | % | 3.46 | % | 3.81 | % | 4.13 | % | 4.36 | % | 4.53 | % | 4.63 | % | 4.68 | % |
2022Q3 | 0.74 | % | 1.56 | % | 2.25 | % | 2.92 | % | 3.52 | % | 4.05 | % | 4.51 | % | 4.85 | % | 5.10 | % | — |
| — |
| — |
|
2022Q4 | 0.71 | % | 1.62 | % | 2.47 | % | 3.27 | % | 3.94 | % | 4.49 | % | — |
| — |
| — |
| — |
| — |
| — |
|
2023Q1 | 0.68 | % | 1.50 | % | 2.32 | % | — |
| — |
| — |
| — |
| — |
| — |
| — |
| — |
| — |
|
|
|
|
|
|
|
|
|
|
|
|
|
|
|
|
|
|
|
|
|
|
|
|
|
|
Business Outlook
The Company expects its loan facilitation volume for the fourth quarter of 2023 to reach approximately RMB20 billion. This forecast reflects the Company’s current and preliminary views on the market and operational conditions, which are subject to change.
Recent Development
Name Change of the Consolidated VIE
The English name of Shanghai Jiayin Finance Technology Co., Ltd., a limited liability company established under PRC law and the consolidated variable interest entity, has been officially changed to “Shanghai Jiayin Technology Co., Ltd.,” or Jiayin Technology. Simultaneously, the Chinese name of Jiayin Technology has been changed from “上海嘉银金融科技股份有限公司” to “上海嘉银科技股份有限公司”. The Company’s management believes that this rebranding better aligns with the Company’s commitment to facilitating effective, transparent, secure and fast connections between underserved individual borrowers and financial institutions through the continuous enhancement of its technological capabilities.
Share Repurchase Plan Update
On June 13, 2022, the Company’s board of directors authorized a share repurchase plan under which the Company may repurchase its ordinary shares with an aggregate value of US$10 million during the 12-month period beginning on June 13, 2022.
On June 7, 2023, the Company’s board of directors approved to extend the share repurchase plan for a period of 12 months, commencing on June 13, 2023 and ending on June 12, 2024. Pursuant to the extended share repurchase plan, the Company may repurchase its ordinary shares through June 12, 2024 with an aggregate value not exceeding the remaining balance under the share repurchase plan. As of September 30, 2023, the Company had repurchased approximately 1.8 million of its American depositary shares for approximately US$5.5 million under this share repurchase plan.
Cash Dividend
The Company is in the process of formulating its plan for the second tranche of dividends in fiscal year 2023. On November 22, 2023, the Company’s board of directors approved the payment of a cash dividend of US$0.10 per ordinary share, or US$0.40 per American depositary share (“ADS”). The dividend record date will be determined and announced in due course by the Company.
Conference Call
The Company will conduct a conference call to discuss its financial results on November 22, 2023 at 8:00 AM U.S. Eastern Time (9:00 PM Beijing/Hong Kong Time on the same day).
To join the conference call, all participants must use the following link to complete the online registration process in advance. Upon registering, each participant will receive access details for this event including the dial-in numbers, a PIN number, and an e-mail with detailed instructions to join the conference call.
Participant Online Registration:
https://s1.c-conf.com/diamondpass/10034988-nsy8b4.html
A live and archived webcast of the conference call will be available on the Company’s investors relations website at http://ir.jiayin-fintech.com/.
About Jiayin Group Inc.
Jiayin Group Inc. is a leading fintech platform in China committed to facilitating effective, transparent, secure and fast connections between underserved individual borrowers and financial institutions. The origin of the business of the Company can be traced back to 2011. The Company operates a highly secure and open platform with a comprehensive risk management system and a proprietary and effective risk assessment model which employs advanced big data analytics and sophisticated algorithms to accurately assess the risk profiles of potential borrowers. For more information, please visit https://ir.jiayin-fintech.com/.
Exchange Rate Information
This announcement contains translations of certain RMB amounts into U.S. dollars (“US$”) at a specified rates solely for the convenience of the reader. Unless otherwise noted, all translations from RMB to U.S. dollars are made at a rate of RMB7.2960 to US$1.00, the exchange rate set forth in the H.10 statistical release of the Board of Governors of the Federal Reserve System as of September 29, 2023. The Company makes no representation that the RMB or US$ amounts referred could be converted into US$ or RMB, as the case may be, at any particular rate or at all.
Safe Harbor / Forward-Looking Statements
This announcement contains forward-looking statements. These statements are made under the “safe harbor” provisions of the United States Private Securities Litigation Reform Act of 1995. These forward-looking statements can be identified by terminology such as “will,” “expects,” “anticipates,” “future,” “intends,” “plans,” “believes,” “estimates” and similar statements. The Company may also make written or oral forward-looking statements in its periodic reports to the SEC, in its annual report to shareholders, in press releases and other written materials and in oral statements made by its officers, directors or employees to third parties. Statements that are not historical facts, including statements about the Company’s beliefs and expectations, are forward-looking statements. Forward-looking statements involve inherent risks and uncertainties and are based on current expectations, assumptions, estimates and projections about the Company and the industry. Potential risks and uncertainties include, but are not limited to, those relating to the Company’s ability to retain existing investors and borrowers and attract new investors and borrowers in an effective and cost-efficient way, the Company’s ability to increase the investment volume and loan origination of loans volume facilitated through its marketplace, effectiveness of the Company’s credit assessment model and risk management system, PRC laws and regulations relating to the online individual finance industry in China, general economic conditions in China, and the Company’s ability to meet the standards necessary to maintain listing of its ADSs on the Nasdaq Stock Market or other stock exchange, including its ability to cure any non-compliance with the continued listing criteria of the Nasdaq Stock Market. All information provided in this press release is as of the date hereof, and the Company undertakes no obligation to update any forward-looking statements to reflect subsequent occurring events or circumstances, or changes in its expectations, except as may be required by law. Although the Company believes that the expectations expressed in these forward-looking statements are reasonable, it cannot assure you that its expectations will turn out to be correct, and investors are cautioned that actual results may differ materially from the anticipated results. Further information regarding risks and uncertainties faced by the Company is included in the Company’s filings with the U.S. Securities and Exchange Commission, including its annual report on Form 20-F.
For investor and media inquiries, please contact:
Jiayin Group
Mr. Shawn Zhang
Email: ir@jiayinfintech.cn
or
The Blueshirt Group
Ms. Ally Wang
Email: ally@blueshirtgroup.com
JIAYIN GROUP INC. | ||||||||||||
| ||||||||||||
|
| As of |
|
| As of |
| ||||||
|
| 2022 |
|
| 2023 |
| ||||||
|
| RMB |
|
| RMB |
|
| US$ |
| |||
ASSETS |
|
|
|
|
|
|
|
|
|
|
|
|
Cash and cash equivalents |
|
| 291,018 |
|
|
| 180,274 |
|
|
| 24,709 |
|
Restricted cash |
|
| 2,023 |
|
|
| 2,023 |
|
|
| 277 |
|
Amounts due from related parties |
|
| 17,750 |
|
|
| 508 |
|
|
| 70 |
|
Accounts receivable and contract assets, net |
|
| 1,732,218 |
|
|
| 2,103,613 |
|
|
| 288,324 |
|
Financial assets receivables |
|
| 292,342 |
|
|
| 1,134,364 |
|
|
| 155,478 |
|
Loan receivables, net |
|
| 3,151 |
|
|
| 3,150 |
|
|
| 432 |
|
Prepaid expenses and other current assets3 |
|
| 472,830 |
|
|
| 1,419,507 |
|
|
| 194,557 |
|
Deferred tax assets, net |
|
| 70,778 |
|
|
| 71,482 |
|
|
| 9,797 |
|
Property and equipment, net |
|
| 18,900 |
|
|
| 30,101 |
|
|
| 4,126 |
|
Right-of-use assets |
|
| 27,604 |
|
|
| 54,529 |
|
|
| 7,474 |
|
Long-term investment |
|
| 90,497 |
|
|
| 93,759 |
|
|
| 12,851 |
|
Other non-current assets |
|
| 1,759 |
|
|
| 2,252 |
|
|
| 309 |
|
TOTAL ASSETS |
|
| 3,020,870 |
|
|
| 5,095,562 |
|
|
| 698,404 |
|
LIABILITIES AND EQUITY |
|
|
|
|
|
|
|
|
|
|
|
|
Deferred guarantee income |
|
| 276,518 |
|
|
| 1,113,320 |
|
|
| 152,593 |
|
Payroll and welfare payable |
|
| 81,558 |
|
|
| 77,025 |
|
|
| 10,557 |
|
Amounts due to related parties |
|
| 566 |
|
|
| 8,912 |
|
|
| 1,221 |
|
Tax payables |
|
| 632,825 |
|
|
| 820,124 |
|
|
| 112,407 |
|
Accrued expenses and other current liabilities4 |
|
| 572,135 |
|
|
| 969,374 |
|
|
| 132,862 |
|
Deferred tax liabilities |
|
| - |
|
|
| 2,036 |
|
|
| 279 |
|
Other payable related to the disposal of Shanghai Caiyin |
|
| 188,300 |
|
|
| 4,464 |
|
|
| 612 |
|
Lease liabilities |
|
| 27,465 |
|
|
| 53,223 |
|
|
| 7,295 |
|
TOTAL LIABILITIES |
|
| 1,779,367 |
|
|
| 3,048,478 |
|
|
| 417,826 |
|
SHAREHOLDERS' EQUITY |
|
|
|
|
|
|
|
|
|
|
|
|
Class A ordinary shares (US$ 0.000000005 par value; |
|
| — |
|
|
| — |
|
|
| — |
|
Class B ordinary shares (US$ 0.000000005 par value; |
|
| — |
|
|
| — |
|
|
| — |
|
Additional paid-in capital |
|
| 870,562 |
|
|
| 900,594 |
|
|
| 123,437 |
|
Treasury stock (2,372,596 and 1,359,792 shares as of December |
|
| (9,262 | ) |
|
| (14,995 | ) |
|
| (2,055 | ) |
Retained earnings |
|
| 384,896 |
|
|
| 1,158,079 |
|
|
| 158,728 |
|
Accumulated other comprehensive (loss)/income |
|
| (3,112 | ) |
|
| 4,991 |
|
|
| 687 |
|
Total Jiayin Group Inc. shareholder's equity |
|
| 1,243,084 |
|
|
| 2,048,669 |
|
|
| 280,797 |
|
Non-controlling interests |
|
| (1,581 | ) |
|
| (1,585 | ) |
|
| (219 | ) |
TOTAL SHAREHOLDERS' EQUITY |
|
| 1,241,503 |
|
|
| 2,047,084 |
|
|
| 280,578 |
|
TOTAL LIABILITIES AND EQUITY |
|
| 3,020,870 |
|
|
| 5,095,562 |
|
|
| 698,404 |
|
|
|
|
|
|
|
|
|
|
|
|
|
|
JIAYIN GROUP INC. | |||||||||||||||||||||||||
| |||||||||||||||||||||||||
|
| For the Three Months Ended |
|
| For the Nine Months Ended |
| |||||||||||||||||||
|
| 2022 |
|
| 2023 |
|
| 2022 |
|
| 2023 |
| |||||||||||||
|
| RMB |
|
| RMB |
|
| US$ |
|
| RMB |
|
| RMB |
|
| US$ |
| |||||||
Net revenue (including revenue from |
|
| 894,295 |
|
|
| 1,466,344 |
|
|
| 200,979 |
|
|
| 2,217,022 |
|
|
| 3,866,330 |
|
|
| 529,925 |
| |
Operating costs and expenses: |
|
|
|
|
|
|
|
|
|
|
|
|
|
|
|
|
|
|
|
|
|
|
|
| |
Origination and servicing |
|
| (148,444 | ) |
|
| (544,251 | ) |
|
| (74,596 | ) |
|
| (370,129 | ) |
|
| (1,174,305 | ) |
|
| (160,952 | ) | |
Allowance for uncollectible receivables, |
|
| (5,918 | ) |
|
| (8,491 | ) |
|
| (1,164 | ) |
|
| (16,980 | ) |
|
| (29,011 | ) |
|
| (3,976 | ) | |
|
|
| (323,592 | ) |
|
|
| ) |
|
|
| ) |
|
| (707,411 | ) |
|
|
| ) |
|
| (165,771 | ) | |
|
|
| (51,408 | ) |
|
|
| ) |
|
|
| ) |
|
| (134,719 | ) |
|
|
| ) |
|
| (20,514 | ) | |
|
|
| (56,357 | ) |
|
|
| ) |
|
|
| ) |
|
| (152,252 | ) |
|
|
| ) |
|
| (27,878 | ) | |
Total operating costs and expenses |
|
| (585,719 | ) |
|
| (1,084,423 | ) |
|
| (148,632 | ) |
|
| (1,381,491 | ) |
|
| (2,765,850 | ) |
|
| (379,091 | ) | |
Income from operation |
|
| 308,576 |
|
|
| 381,921 |
|
|
| 52,347 |
|
|
| 835,531 |
|
|
| 1,100,480 |
|
|
| 150,834 |
| |
|
|
| 610 |
|
|
|
|
|
|
|
|
|
|
| 1,226 |
|
|
|
|
|
|
| 677 |
| |
|
|
| 13,738 |
|
|
|
|
|
|
|
|
|
|
| 7,122 |
|
|
|
|
|
|
| 1,861 |
| |
Income before income taxes and income |
|
| 322,924 |
|
|
| 387,445 |
|
|
| 53,104 |
|
|
| 843,879 |
|
|
|
|
|
|
| 153,372 |
| |
|
|
| (77,679 | ) |
|
|
| ) |
|
|
| ) |
|
| (205,393 | ) |
|
|
| ) |
|
| (25,364 | ) | |
Income (loss) from investment |
|
| 2,821 |
|
|
| (1,738 | ) |
|
| (238 | ) |
|
| 8,048 |
|
|
| (4,002 | ) |
|
| (549 | ) | |
Net income |
|
| 248,066 |
|
|
| 323,901 |
|
|
| 44,395 |
|
|
| 646,534 |
|
|
| 929,942 |
|
|
| 127,459 |
| |
Less: net (loss) income attributable to |
|
| (74 | ) |
|
| 108 |
|
|
| 15 |
|
|
| (187 | ) |
|
| 85 |
|
|
| 12 |
| |
Net income attributable to |
|
| 248,140 |
|
|
| 323,793 |
|
|
| 44,380 |
|
|
| 646,721 |
|
|
| 929,857 |
|
|
| 127,447 |
| |
Weighted average shares used in |
|
|
|
|
|
|
|
|
|
|
|
|
|
|
|
|
|
|
|
|
|
|
|
| |
- Basic and diluted |
|
| 215,096,072 |
|
|
| 214,740,208 |
|
|
| 214,740,208 |
|
|
| 215,755,078 |
|
|
| 214,168,317 |
|
|
| 214,168,317 |
| |
Net income per share: |
|
|
|
|
|
|
|
|
|
|
|
|
|
|
|
|
|
|
|
|
|
|
|
| |
- Basic and diluted |
|
| 1.15 |
|
|
| 1.51 |
|
|
| 0.21 |
|
|
| 3.00 |
|
|
| 4.34 |
|
|
| 0.60 |
| |
Net income per ADS: |
|
|
|
|
|
|
|
|
|
|
|
|
|
|
|
|
|
|
|
|
|
|
|
| |
- Basic and diluted |
|
| 4.60 |
|
|
| 6.03 |
|
|
| 0.83 |
|
|
| 12.00 |
|
|
| 17.37 |
|
|
| 2.38 |
| |
Net income |
|
| 248,066 |
|
|
| 323,901 |
|
|
| 44,395 |
|
|
| 646,534 |
|
|
| 929,942 |
|
|
| 127,459 |
| |
Other comprehensive income, |
|
|
|
|
|
|
|
|
|
|
|
|
|
|
|
|
|
|
|
|
|
|
|
| |
Foreign currency translation adjustments |
|
| 9,888 |
|
|
| 2,044 |
|
|
| 280 |
|
|
| 18,983 |
|
|
| 8,014 |
|
|
| 1,098 |
| |
Comprehensive income |
|
| 257,954 |
|
|
| 325,945 |
|
|
| 44,675 |
|
|
| 665,517 |
|
|
| 937,956 |
|
|
| 128,557 |
| |
Comprehensive (Loss) Income |
|
| (162 | ) |
|
| 147 |
|
|
| 20 |
|
|
| (341 | ) |
|
| (4 | ) |
|
| (1 | ) | |
Total comprehensive income |
|
| 258,116 |
|
|
| 325,798 |
|
|
| 44,655 |
|
|
| 665,858 |
|
|
| 937,960 |
|
|
| 128,558 |
| |
|
|
|
|
|
|
|
|
|
|
|
|
|
|
|
|
|
|
|
|
|
|
|
|
| |
___________________________
1 “Loan origination volume” refers the loan origination volume facilitated in Mainland China during the period presented.
2 “Repeat borrowing rate” refers to the repeat borrowers as a percentage of all of our borrowers in Mainland China.
“Repeat borrowers” during a certain period refers to borrowers who have borrowed in such period and have borrowed at least twice since such borrowers’ registration on our platform until the end of such period.
3 Including security deposits of RMB414,400 and RMB1,227,413, held in accounts designated by institutional funding partners for provision of the primary guarantee to these funding partners, as of December 31, 2022 and September 30, 2023, respectively.
4 Including security deposits of RMB287,001 and RMB597,285, held by the Company from an asset management company related to the back-to-back guarantee arrangement, as of December 31, 2022 and September 30, 2023, respectively.
5 The total shares authorized for both Class A and Class B are 10,000,000,000,000.
A chart accompanying this announcement is available at https://www.globenewswire.com/NewsRoom/AttachmentNg/f117a065-7b49-4cc4-bc68-703436f70faf

