John B. Sanfilippo & Son, Inc. (NASDAQ:JBSS) Stock Has Shown Weakness Lately But Financials Look Strong: Should Prospective Shareholders Make The Leap?
John B. Sanfilippo & Son (NASDAQ:JBSS) has had a rough three months with its share price down 13%. However, a closer look at its sound financials might cause you to think again. Given that fundamentals usually drive long-term market outcomes, the company is worth looking at. Specifically, we decided to study John B. Sanfilippo & Son's ROE in this article.
Return on equity or ROE is an important factor to be considered by a shareholder because it tells them how effectively their capital is being reinvested. Put another way, it reveals the company's success at turning shareholder investments into profits.
See our latest analysis for John B. Sanfilippo & Son
How Do You Calculate Return On Equity?
The formula for return on equity is:
Return on Equity = Net Profit (from continuing operations) ÷ Shareholders' Equity
So, based on the above formula, the ROE for John B. Sanfilippo & Son is:
22% = US$57m ÷ US$255m (Based on the trailing twelve months to March 2022).
The 'return' is the amount earned after tax over the last twelve months. One way to conceptualize this is that for each $1 of shareholders' capital it has, the company made $0.22 in profit.
What Is The Relationship Between ROE And Earnings Growth?
We have already established that ROE serves as an efficient profit-generating gauge for a company's future earnings. Depending on how much of these profits the company reinvests or "retains", and how effectively it does so, we are then able to assess a company’s earnings growth potential. Assuming everything else remains unchanged, the higher the ROE and profit retention, the higher the growth rate of a company compared to companies that don't necessarily bear these characteristics.
John B. Sanfilippo & Son's Earnings Growth And 22% ROE
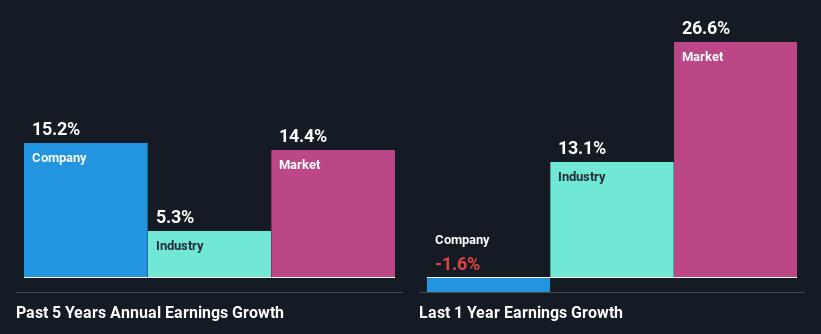
Firstly, we acknowledge that John B. Sanfilippo & Son has a significantly high ROE. Additionally, the company's ROE is higher compared to the industry average of 11% which is quite remarkable. This likely paved the way for the modest 15% net income growth seen by John B. Sanfilippo & Son over the past five years. growth
Next, on comparing with the industry net income growth, we found that John B. Sanfilippo & Son's growth is quite high when compared to the industry average growth of 5.3% in the same period, which is great to see.
Earnings growth is a huge factor in stock valuation. The investor should try to establish if the expected growth or decline in earnings, whichever the case may be, is priced in. This then helps them determine if the stock is placed for a bright or bleak future. Is John B. Sanfilippo & Son fairly valued compared to other companies? These 3 valuation measures might help you decide.
Is John B. Sanfilippo & Son Efficiently Re-investing Its Profits?
John B. Sanfilippo & Son's three-year median payout ratio to shareholders is 14% (implying that it retains 86% of its income), which is on the lower side, so it seems like the management is reinvesting profits heavily to grow its business.
Besides, John B. Sanfilippo & Son has been paying dividends over a period of nine years. This shows that the company is committed to sharing profits with its shareholders.
Conclusion
Overall, we are quite pleased with John B. Sanfilippo & Son's performance. Particularly, we like that the company is reinvesting heavily into its business, and at a high rate of return. Unsurprisingly, this has led to an impressive earnings growth. If the company continues to grow its earnings the way it has, that could have a positive impact on its share price given how earnings per share influence long-term share prices. Not to forget, share price outcomes are also dependent on the potential risks a company may face. So it is important for investors to be aware of the risks involved in the business. You can see the 2 risks we have identified for John B. Sanfilippo & Son by visiting our risks dashboard for free on our platform here.
Have feedback on this article? Concerned about the content? Get in touch with us directly. Alternatively, email editorial-team (at) simplywallst.com.
This article by Simply Wall St is general in nature. We provide commentary based on historical data and analyst forecasts only using an unbiased methodology and our articles are not intended to be financial advice. It does not constitute a recommendation to buy or sell any stock, and does not take account of your objectives, or your financial situation. We aim to bring you long-term focused analysis driven by fundamental data. Note that our analysis may not factor in the latest price-sensitive company announcements or qualitative material. Simply Wall St has no position in any stocks mentioned.
