John Bean (JBT) Q2 Earnings Up Y/Y on Strong FoodTech Results
John Bean Technologies Corporation JBT reported adjusted earnings of 97 cents per share in second-quarter 2023, which came in 11.5% higher than the prior-year quarter. High order levels, improved price-cost realization, lower discretionary costs, and gains from the company’s restructuring actions were instrumental in driving the improved results in the quarter. JBT also completed the sale of the AeroTech segment, fulfilling its target to become a pure-play provider of food and beverage solutions.
On a reported basis, the company’s earnings per share (from continuing operations) were 87 cents, compared with the prior-year quarter’s earnings per share of 80 cents.
AeroTech Sale Completed
JBT closed the previously-announced sale of the AeroTech segment to Oshkosh Corporation OSK for $800 million. Effective second quarter, AeroTech's financial results have been classified as discontinued operations.
John Bean expects net proceeds (after taxes and transaction costs) to be around $650 million, which will be utilized toward repaying debt and investing in strategic acquisition.
John Bean Technologies Corporation Price, Consensus and EPS Surprise
John Bean Technologies Corporation price-consensus-eps-surprise-chart | John Bean Technologies Corporation Quote
Higher Orders Drive Revenues
Revenues of $428 million increased 8.6% from the year-ago quarter. Organic growth was 2% in the quarter while acquisitions contributed 8%. However, unfavorable foreign currency impacted sales by 1%. Higher mix of recurring revenues also aided the improvement.
The top-line figure was in line with our model estimate of revenues of $429 million for the FoodTech segment. We had estimated organic growth at 5% for the segment and a contribution from acquisitions of 5.6%.
In the reported quarter, the company’s orders (from continuing operations) increased 13% year over year to $445 million. The figure came in higher than our projection of orders of $423.6 million for the FoodTech segment.
Backlog (from continuing operations) was $697 million at the end of the second quarter, up 4% year over year. Our projection for the FoodTech segment’s backlog was at $673 million.
Margin Expansion
The cost of sales increased 6% year over year to $281 million in the second quarter. Gross profit was up 14% year over year to $146 million. The gross margin was 34.2%, compared with the year-earlier quarter’s figure of 32.7%.
Selling, general and administrative expenses were up 4.7% year over year to $100 million. Adjusted operating profit improved 40% year over year to $46 million from the prior-year quarter’s $33 million. Adjusted operating margin was 10.7%, compared with 8.3% in the second quarter of 2022.
In the quarter under review, adjusted EBITDA was around $71.4 million, reflecting a year-over-year increase of 34%. Adjusted EBITDA margin was 16.7%, compared with the year-ago quarter’s figure of 13.5%. Excluding corporate related costs, the adjusted EBITDA margin for JBT's FoodTech operations was 19.7%. The figuer was higher than the company’s guidance of 18-18.75% and our model estimate of 18%.
Financial Performance
John Bean reported cash and cash equivalents of $43 million at the end of the second quarter of 2023, down from $72 million at the end of 2022. The company generated around $63 million in cash from operating activities in the six-month period ended Jun 30, 2023, compared with $75 million in the prior-year period.
The company’s total debt was $951 million as of Jun 30 2023, down from $975 million as of Dec 31, 2022. Liquidity, as of the end of the second quarter, was $600 million (prior to the sale of the AeroTech segment).
Guidance for 2023
The company expects revenues in 2023 to be in the range of $1,670-$1,730 million. Adjusted earnings per share is projected to be between $3.25 and $3.65. Adjusted EBITDA is anticipated within $253-$278 million.
For the third quarter, revenues are expected to be in the range of $410 million to $425 million. Adjusted EBITDA will range between $63 million and $68 million. JBT expects adjusted earnings per share to be between 90 cents and $1.25 for third-quarter 2023.
JBT stated that during this year, it will be initiating additional restructuring actions and the same will be around $11 - $13 million. This brings the total cost of its existing restructuring program to $16 - $18 million. The company expects annualized run-rate savings of $18 - $20 million by mid-2024 stemming from these actions.
Price Performance
John Bean’s shares have gained 8.6% in the past year compared with the industry’s 0.9% growth.
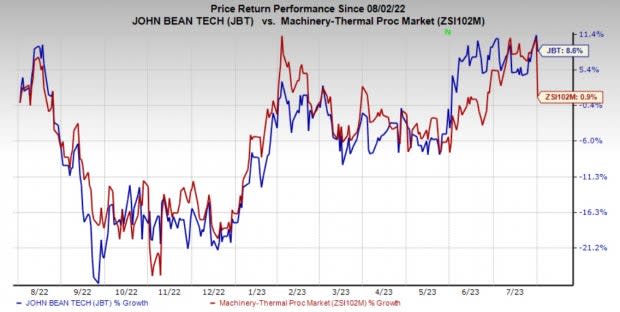
Image Source: Zacks Investment Research
Zacks Rank & Stocks to Consider
John Bean carries a Zacks Rank #5 (Strong Sell).
Some better-ranked stocks from the Industrial Products sector are Worthington Industries, Inc. WOR and The Manitowoc Company, Inc. MTW. WOR and MTW sport a Zacks Rank #1 (Strong Buy) at present. You can see the complete list of today’s Zacks #1 Rank stocks here.
Worthington Industries has an average trailing four-quarter earnings surprise of 14.9%. The Zacks Consensus Estimate for WOR’s fiscal 2023 earnings is pegged at $5.65 per share. The consensus estimate for 2023 earnings has moved 22.6% north in the past 60 days. Its shares have gained 52% in the last year.
Manitowoc has an average trailing four-quarter earnings surprise of 256.3%. The Zacks Consensus Estimate for MTW’s 2023 earnings is pegged at $1.12 per share. The consensus estimate for 2023 earnings has moved 7.8% north in the past 60 days. MTW’s shares have gained 58% in the last year.
Want the latest recommendations from Zacks Investment Research? Today, you can download 7 Best Stocks for the Next 30 Days. Click to get this free report
The Manitowoc Company, Inc. (MTW) : Free Stock Analysis Report
Worthington Industries, Inc. (WOR) : Free Stock Analysis Report
Oshkosh Corporation (OSK) : Free Stock Analysis Report
John Bean Technologies Corporation (JBT) : Free Stock Analysis Report
