Joint (NASDAQ:JYNT) investors are sitting on a loss of 63% if they invested three years ago
The Joint Corp. (NASDAQ:JYNT) shareholders should be happy to see the share price up 16% in the last month. But that doesn't change the fact that the returns over the last three years have been disappointing. Regrettably, the share price slid 63% in that period. So it's good to see it climbing back up. While many would remain nervous, there could be further gains if the business can put its best foot forward.
With that in mind, it's worth seeing if the company's underlying fundamentals have been the driver of long term performance, or if there are some discrepancies.
See our latest analysis for Joint
To quote Buffett, 'Ships will sail around the world but the Flat Earth Society will flourish. There will continue to be wide discrepancies between price and value in the marketplace...' By comparing earnings per share (EPS) and share price changes over time, we can get a feel for how investor attitudes to a company have morphed over time.
During the three years that the share price fell, Joint's earnings per share (EPS) dropped by 20% each year. This reduction in EPS is slower than the 28% annual reduction in the share price. So it seems the market was too confident about the business, in the past. Having said that, the market is still optimistic, given the P/E ratio of 69.44.
You can see below how EPS has changed over time (discover the exact values by clicking on the image).
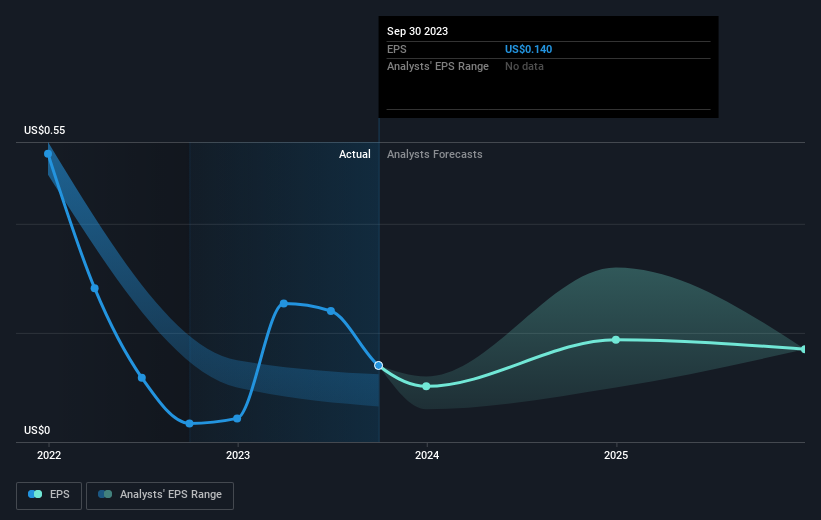
We know that Joint has improved its bottom line lately, but is it going to grow revenue? You could check out this free report showing analyst revenue forecasts.
A Different Perspective
Joint shareholders are down 40% for the year, but the market itself is up 17%. Even the share prices of good stocks drop sometimes, but we want to see improvements in the fundamental metrics of a business, before getting too interested. On the bright side, long term shareholders have made money, with a gain of 7% per year over half a decade. It could be that the recent sell-off is an opportunity, so it may be worth checking the fundamental data for signs of a long term growth trend. It's always interesting to track share price performance over the longer term. But to understand Joint better, we need to consider many other factors. Consider for instance, the ever-present spectre of investment risk. We've identified 1 warning sign with Joint , and understanding them should be part of your investment process.
If you are like me, then you will not want to miss this free list of growing companies that insiders are buying.
Please note, the market returns quoted in this article reflect the market weighted average returns of stocks that currently trade on American exchanges.
Have feedback on this article? Concerned about the content? Get in touch with us directly. Alternatively, email editorial-team (at) simplywallst.com.
This article by Simply Wall St is general in nature. We provide commentary based on historical data and analyst forecasts only using an unbiased methodology and our articles are not intended to be financial advice. It does not constitute a recommendation to buy or sell any stock, and does not take account of your objectives, or your financial situation. We aim to bring you long-term focused analysis driven by fundamental data. Note that our analysis may not factor in the latest price-sensitive company announcements or qualitative material. Simply Wall St has no position in any stocks mentioned.
