Kaman Corporation (NYSE:KAMN) is largely controlled by institutional shareholders who own 88% of the company
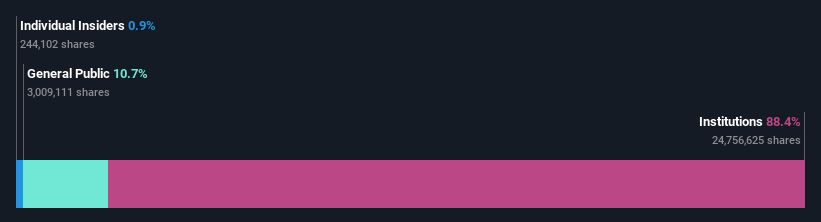
To get a sense of who is truly in control of Kaman Corporation (NYSE:KAMN), it is important to understand the ownership structure of the business. We can see that institutions own the lion's share in the company with 88% ownership. That is, the group stands to benefit the most if the stock rises (or lose the most if there is a downturn).
Since institutional have access to huge amounts of capital, their market moves tend to receive a lot of scrutiny by retail or individual investors. Hence, having a considerable amount of institutional money invested in a company is often regarded as a desirable trait.
In the chart below, we zoom in on the different ownership groups of Kaman.
Check out our latest analysis for Kaman
What Does The Institutional Ownership Tell Us About Kaman?
Institutional investors commonly compare their own returns to the returns of a commonly followed index. So they generally do consider buying larger companies that are included in the relevant benchmark index.
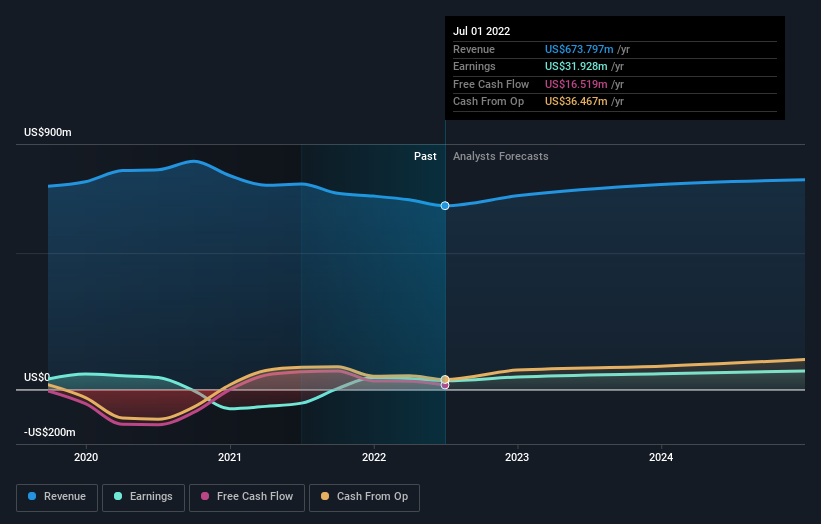
Kaman already has institutions on the share registry. Indeed, they own a respectable stake in the company. This implies the analysts working for those institutions have looked at the stock and they like it. But just like anyone else, they could be wrong. It is not uncommon to see a big share price drop if two large institutional investors try to sell out of a stock at the same time. So it is worth checking the past earnings trajectory of Kaman, (below). Of course, keep in mind that there are other factors to consider, too.
Institutional investors own over 50% of the company, so together than can probably strongly influence board decisions. We note that hedge funds don't have a meaningful investment in Kaman. The company's largest shareholder is BlackRock, Inc., with ownership of 18%. Meanwhile, the second and third largest shareholders, hold 11% and 11%, of the shares outstanding, respectively.
To make our study more interesting, we found that the top 5 shareholders control more than half of the company which implies that this group has considerable sway over the company's decision-making.
While studying institutional ownership for a company can add value to your research, it is also a good practice to research analyst recommendations to get a deeper understand of a stock's expected performance. There is some analyst coverage of the stock, but it could still become more well known, with time.
Insider Ownership Of Kaman
While the precise definition of an insider can be subjective, almost everyone considers board members to be insiders. The company management answer to the board and the latter should represent the interests of shareholders. Notably, sometimes top-level managers are on the board themselves.
I generally consider insider ownership to be a good thing. However, on some occasions it makes it more difficult for other shareholders to hold the board accountable for decisions.
Our data suggests that insiders own under 1% of Kaman Corporation in their own names. It appears that the board holds about US$7.0m worth of stock. This compares to a market capitalization of US$806m. Many tend to prefer to see a board with bigger shareholdings. A good next step might be to take a look at this free summary of insider buying and selling.
General Public Ownership
The general public, who are usually individual investors, hold a 11% stake in Kaman. This size of ownership, while considerable, may not be enough to change company policy if the decision is not in sync with other large shareholders.
Next Steps:
It's always worth thinking about the different groups who own shares in a company. But to understand Kaman better, we need to consider many other factors. To that end, you should be aware of the 1 warning sign we've spotted with Kaman .
If you are like me, you may want to think about whether this company will grow or shrink. Luckily, you can check this free report showing analyst forecasts for its future.
NB: Figures in this article are calculated using data from the last twelve months, which refer to the 12-month period ending on the last date of the month the financial statement is dated. This may not be consistent with full year annual report figures.
Have feedback on this article? Concerned about the content? Get in touch with us directly. Alternatively, email editorial-team (at) simplywallst.com.
This article by Simply Wall St is general in nature. We provide commentary based on historical data and analyst forecasts only using an unbiased methodology and our articles are not intended to be financial advice. It does not constitute a recommendation to buy or sell any stock, and does not take account of your objectives, or your financial situation. We aim to bring you long-term focused analysis driven by fundamental data. Note that our analysis may not factor in the latest price-sensitive company announcements or qualitative material. Simply Wall St has no position in any stocks mentioned.
Join A Paid User Research Session
You’ll receive a US$30 Amazon Gift card for 1 hour of your time while helping us build better investing tools for the individual investors like yourself. Sign up here
