Is Kew Media Group Inc’s (TSX:KEW) Balance Sheet A Threat To Its Future?

Investors are always looking for growth in small-cap stocks like Kew Media Group Inc (TSX:KEW), with a market cap of CAD CA$108.70M. However, an important fact which most ignore is: how financially healthy is the company? There are always disruptions which destabilize an existing industry, in which most small-cap companies are the first casualties. Here are few basic financial health checks to judge whether a company fits the bill or there is an additional risk which you should consider before taking the plunge. View our latest analysis for Kew Media Group
Does KEW generate an acceptable amount of cash through operations?
There are many headwinds that come unannounced, such as natural disasters and political turmoil, which can challenge a small business and its ability to adapt and recover. These catastrophes does not mean the company can stop servicing its debt obligations. We can test the impact of these adverse events by looking at whether cash from its current operations can pay back its current debt obligations. In the case of KEW, operating cash flow turned out to be -0.35x its debt level over the past twelve months. This means what KEW can generate on an annual basis, which is currently a negative value, does not cover what it actually owes its debtors in the near term. This raises a red flag, looking at KEW’s operations at this point in time.
Can KEW pay its short-term liabilities?
What about its other commitments such as payments to suppliers and salaries to its employees? During times of unfavourable events, KEW could be required to liquidate some of its assets to meet these upcoming payments, as cash flow from operations is hindered. We test for KEW’s ability to meet these needs by comparing its cash and short-term investments with current liabilities. Our analysis shows that KEW is able to meet its upcoming commitments with its cash and other short-term assets, which lessens our concerns for the company’s business operations should any unfavourable circumstances arise.
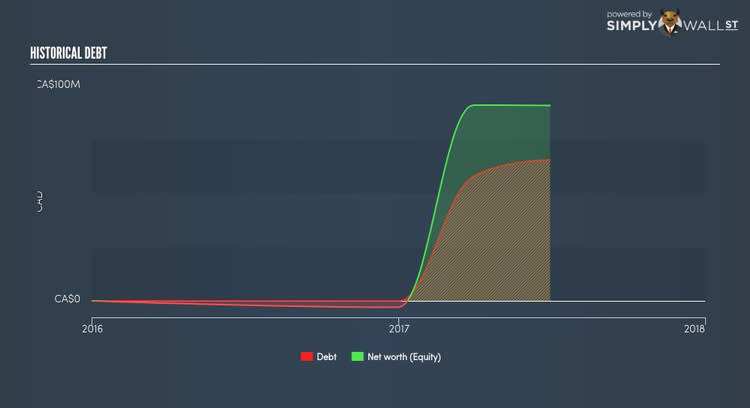
Does KEW face the risk of succumbing to its debt-load?
Debt-to-equity ratio tells us how much of the asset debtors could claim if the company went out of business. In the case of KEW, the debt-to-equity ratio is 72.19%, which indicates that its debt can cause trouble for the company in a downturn but it is still at a manageable level. While debt-to-equity ratio has several factors at play, an easier way to check whether KEW’s leverage is at a sustainable level is to check its ability to service the debt. A company generating earnings at least three times its interest payments is considered financially sound. KEW’s interest on debt is sufficiently covered by earnings as it sits at around 6.71x. Lenders may be less hesitant to lend out more funding as KEW’s high interest coverage is seen as responsible and safe practice.
Next Steps:
Are you a shareholder? KEW’s debt and cash flow levels indicate room for improvement. Its cash flow coverage of less than a quarter of debt means that operating efficiency could be an issue. However, the company exhibits an ability to meet its near term obligations should an adverse event occur. Given that KEW’s financial situation may change. I recommend researching market expectations for KEW’s future growth on our free analysis platform.
Are you a potential investor? Though short-term liquidity isn’t a concern, KEW’s high debt levels along with low cash coverage of debt may scare some investors away intially. However, keep in mind that this is a point-in-time analysis, and today’s performance may not be representative of KEW’s track record. I encourage you to continue your research by taking a look at KEW’s past performance analysis on our free platform to figure out KEW’s financial health position.
To help readers see pass the short term volatility of the financial market, we aim to bring you a long-term focused research analysis purely driven by fundamental data. Note that our analysis does not factor in the latest price sensitive company announcements.
The author is an independent contributor and at the time of publication had no position in the stocks mentioned.
