Key Things To Watch Out For If You Are After Australian Vintage Ltd's (ASX:AVG) 3.9% Dividend

Dividend paying stocks like Australian Vintage Ltd (ASX:AVG) tend to be popular with investors, and for good reason - some research suggests a significant amount of all stock market returns come from reinvested dividends. Unfortunately, it's common for investors to be enticed in by the seemingly attractive yield, and lose money when the company has to cut its dividend payments.
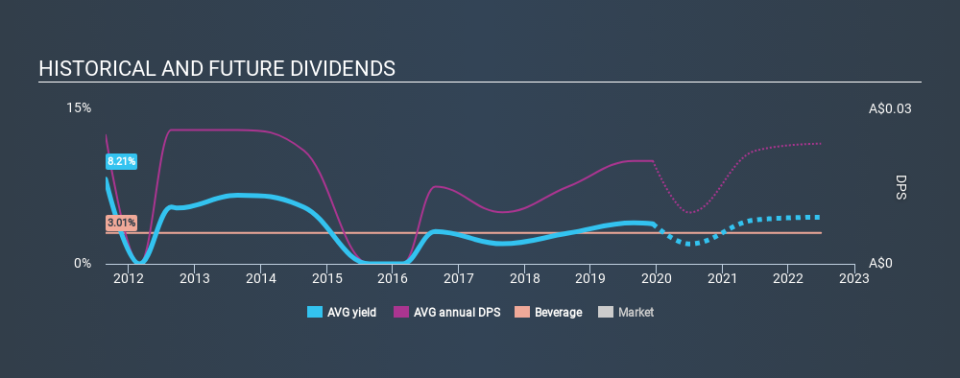
In this case, Australian Vintage likely looks attractive to dividend investors, given its 3.9% dividend yield and eight-year payment history. It sure looks interesting on these metrics - but there's always more to the story . Some simple research can reduce the risk of buying Australian Vintage for its dividend - read on to learn more.
Explore this interactive chart for our latest analysis on Australian Vintage!
Payout ratios
Dividends are usually paid out of company earnings. If a company is paying more than it earns, then the dividend might become unsustainable - hardly an ideal situation. As a result, we should always investigate whether a company can afford its dividend, measured as a percentage of a company's net income after tax. In the last year, Australian Vintage paid out 69% of its profit as dividends. This is a fairly normal payout ratio among most businesses. It allows a higher dividend to be paid to shareholders, but does limit the capital retained in the business - which could be good or bad.
We also measure dividends paid against a company's levered free cash flow, to see if enough cash was generated to cover the dividend. Australian Vintage paid out a conservative 35% of its free cash flow as dividends last year. It's positive to see that Australian Vintage's dividend is covered by both profits and cash flow, since this is generally a sign that the dividend is sustainable, and a lower payout ratio usually suggests a greater margin of safety before the dividend gets cut.
Is Australian Vintage's Balance Sheet Risky?
As Australian Vintage has a meaningful amount of debt, we need to check its balance sheet to see if the company might have debt risks. A quick check of its financial situation can be done with two ratios: net debt divided by EBITDA (earnings before interest, tax, depreciation and amortisation), and net interest cover. Net debt to EBITDA is a measure of a company's total debt. Net interest cover measures the ability to meet interest payments. Essentially we check that a) the company does not have too much debt, and b) that it can afford to pay the interest. With net debt of 2.40 times its EBITDA, Australian Vintage has a noticeable amount of debt, although if business stays steady, this may not be overly concerning.
Net interest cover can be calculated by dividing earnings before interest and tax (EBIT) by the company's net interest expense. Net interest cover of 5.20 times its interest expense appears reasonable for Australian Vintage, although we're conscious that even high interest cover doesn't make a company bulletproof.
Consider getting our latest analysis on Australian Vintage's financial position here.
Dividend Volatility
From the perspective of an income investor who wants to earn dividends for many years, there is not much point buying a stock if its dividend is regularly cut or is not reliable. Looking at the last decade of data, we can see that Australian Vintage paid its first dividend at least eight years ago. It's good to see that Australian Vintage has been paying a dividend for a number of years. However, the dividend has been cut at least once in the past, and we're concerned that what has been cut once, could be cut again. During the past eight-year period, the first annual payment was AU$0.025 in 2011, compared to AU$0.02 last year. This works out to be a decline of approximately 2.8% per year over that time. Australian Vintage's dividend has been cut sharply at least once, so it hasn't fallen by 2.8% every year, but this is a decent approximation of the long term change.
We struggle to make a case for buying Australian Vintage for its dividend, given that payments have shrunk over the past eight years.
Dividend Growth Potential
With a relatively unstable dividend, it's even more important to see if earnings per share (EPS) are growing. Why take the risk of a dividend getting cut, unless there's a good chance of bigger dividends in future? Australian Vintage's EPS have fallen by approximately 11% per year during the past five years. With this kind of significant decline, we always wonder what has changed in the business. Dividends are about stability, and Australian Vintage's earnings per share, which support the dividend, have been anything but stable.
Conclusion
Dividend investors should always want to know if a) a company's dividends are affordable, b) if there is a track record of consistent payments, and c) if the dividend is capable of growing. First, we think Australian Vintage has an acceptable payout ratio and its dividend is well covered by cashflow. Earnings per share are down, and Australian Vintage's dividend has been cut at least once in the past, which is disappointing. While we're not hugely bearish on it, overall we think there are potentially better dividend stocks than Australian Vintage out there.
Are management backing themselves to deliver performance? Check their shareholdings in Australian Vintage in our latest insider ownership analysis.
Looking for more high-yielding dividend ideas? Try our curated list of dividend stocks with a yield above 3%.
If you spot an error that warrants correction, please contact the editor at editorial-team@simplywallst.com. This article by Simply Wall St is general in nature. It does not constitute a recommendation to buy or sell any stock, and does not take account of your objectives, or your financial situation. Simply Wall St has no position in the stocks mentioned.
We aim to bring you long-term focused research analysis driven by fundamental data. Note that our analysis may not factor in the latest price-sensitive company announcements or qualitative material. Thank you for reading.
