Kforce Inc (NASDAQ:KFRC): Has Recent Earnings Growth Beaten Long-Term Trend?

In this commentary, I will examine Kforce Inc’s (NASDAQ:KFRC) latest earnings update (30 June 2018) and compare these figures against its performance over the past couple of years, as well as how the rest of the professional services industry performed. As an investor, I find it beneficial to assess KFRC’s trend over the short-to-medium term in order to gauge whether or not the company is able to meet its goals, and ultimately sustainably grow over time.
View our latest analysis for Kforce
How KFRC fared against its long-term earnings performance and its industry
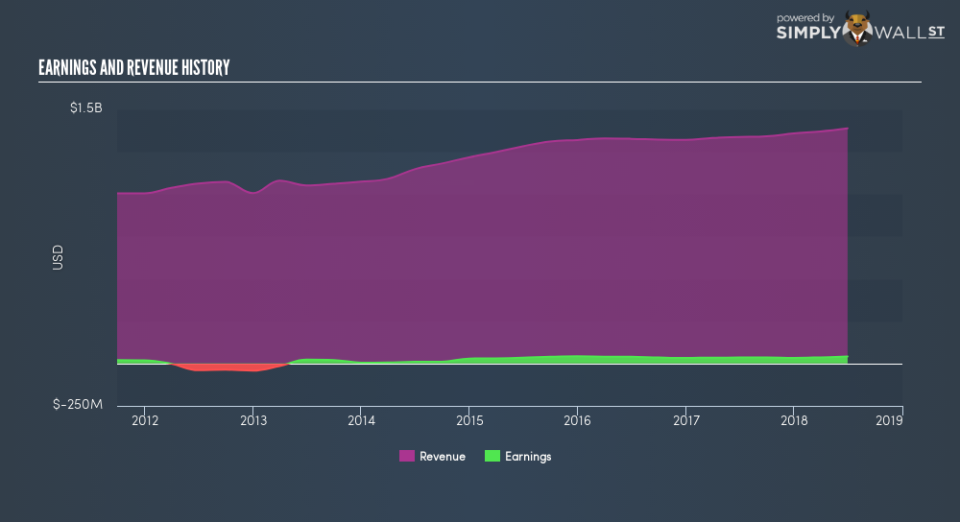
KFRC’s trailing twelve-month earnings (from 30 June 2018) of US$41.7m has jumped 18.1% compared to the previous year. However, this one-year growth rate has been lower than its average earnings growth rate over the past 5 years of 30.7%, indicating the rate at which KFRC is growing has slowed down. Why could this be happening? Well, let’s take a look at what’s going on with margins and if the rest of the industry is feeling the heat.
Over the last few years, revenue growth has been lagging behind which implies that Kforce’s bottom line has been driven by unmaintainable cost-cutting. Inspecting growth from a sector-level, the US professional services industry has been growing its average earnings by double-digit 18.4% in the past year, and 11.5% over the past five. This growth is a median of profitable companies of 24 Professional Services companies in US including Command Center, Mistras Group and InnerWorkings. This shows that whatever uplift the industry is profiting from, Kforce has not been able to gain as much as its average peer.
In terms of returns from investment, Kforce has invested its equity funds well leading to a 27.7% return on equity (ROE), above the sensible minimum of 20%. Furthermore, its return on assets (ROA) of 11.9% exceeds the US Professional Services industry of 7.4%, indicating Kforce has used its assets more efficiently. And finally, its return on capital (ROC), which also accounts for Kforce’s debt level, has increased over the past 3 years from 21.1% to 23.6%.
What does this mean?
Kforce’s track record can be a valuable insight into its earnings performance, but it certainly doesn’t tell the whole story. While Kforce has a good historical track record with positive growth and profitability, there’s no certainty that this will extrapolate into the future. I suggest you continue to research Kforce to get a better picture of the stock by looking at:
Future Outlook: What are well-informed industry analysts predicting for KFRC’s future growth? Take a look at our free research report of analyst consensus for KFRC’s outlook.
Financial Health: Are KFRC’s operations financially sustainable? Balance sheets can be hard to analyze, which is why we’ve done it for you. Check out our financial health checks here.
Other High-Performing Stocks: Are there other stocks that provide better prospects with proven track records? Explore our free list of these great stocks here.
NB: Figures in this article are calculated using data from the trailing twelve months from 30 June 2018. This may not be consistent with full year annual report figures.
To help readers see past the short term volatility of the financial market, we aim to bring you a long-term focused research analysis purely driven by fundamental data. Note that our analysis does not factor in the latest price-sensitive company announcements.
The author is an independent contributor and at the time of publication had no position in the stocks mentioned. For errors that warrant correction please contact the editor at editorial-team@simplywallst.com.
