What Kind Of Shareholders Own Black Diamond Group Limited (TSE:BDI)?

Want to participate in a short research study? Help shape the future of investing tools and you could win a $250 gift card!
A look at the shareholders of Black Diamond Group Limited (TSE:BDI) can tell us which group is most powerful. Generally speaking, as a company grows, institutions will increase their ownership. Conversely, insiders often decrease their ownership over time. I generally like to see some degree of insider ownership, even if only a little. As Nassim Nicholas Taleb said, 'Don’t tell me what you think, tell me what you have in your portfolio.'
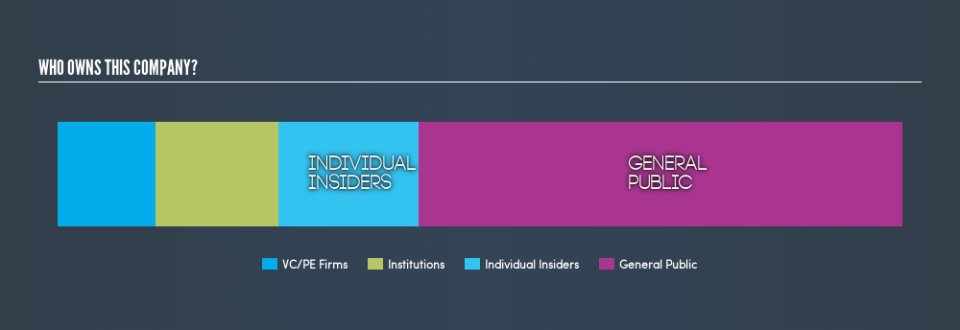
Black Diamond Group is not a large company by global standards. It has a market capitalization of CA$130m, which means it wouldn't have the attention of many institutional investors. Taking a look at our data on the ownership groups (below), it's seems that institutions own shares in the company. We can zoom in on the different ownership groups, to learn more about BDI.
See our latest analysis for Black Diamond Group
What Does The Institutional Ownership Tell Us About Black Diamond Group?
Institutional investors commonly compare their own returns to the returns of a commonly followed index. So they generally do consider buying larger companies that are included in the relevant benchmark index.
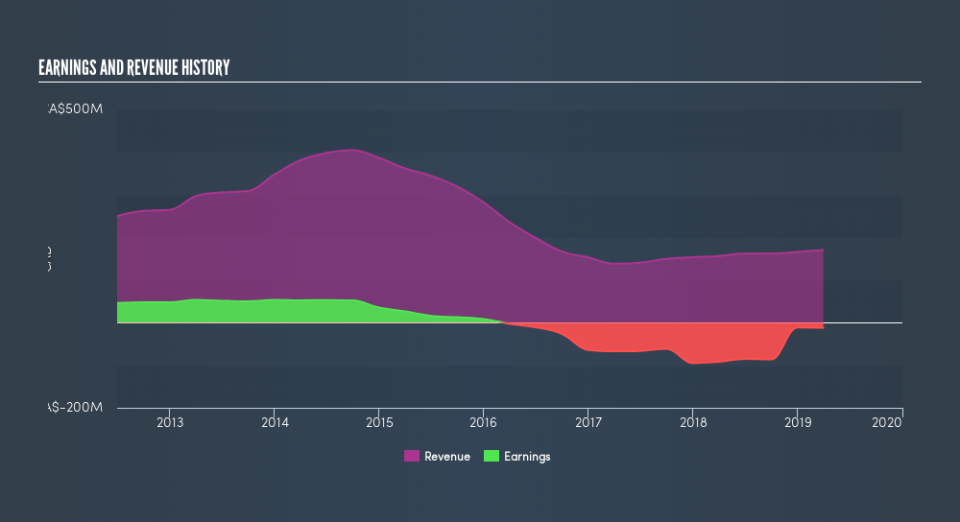
Black Diamond Group already has institutions on the share registry. Indeed, they own 15% of the company. This implies the analysts working for those institutions have looked at the stock and they like it. But just like anyone else, they could be wrong. If multiple institutions change their view on a stock at the same time, you could see the share price drop fast. It's therefore worth looking at Black Diamond Group's earnings history, below. Of course, the future is what really matters.
Hedge funds don't have many shares in Black Diamond Group. There are a reasonable number of analysts covering the stock, so it might be useful to find out their aggregate view on the future.
Insider Ownership Of Black Diamond Group
The definition of an insider can differ slightly between different countries, but members of the board of directors always count. Management ultimately answers to the board. However, it is not uncommon for managers to be executive board members, especially if they are a founder or the CEO.
Insider ownership is positive when it signals leadership are thinking like the true owners of the company. However, high insider ownership can also give immense power to a small group within the company. This can be negative in some circumstances.
It seems insiders own a significant proportion of Black Diamond Group Limited. Insiders own CA$22m worth of shares in the CA$130m company. I would say this shows alignment with shareholders, but it is worth noting that the company is still quite small; some insiders may have founded the business. You can click here to see if those insiders have been buying or selling.
General Public Ownership
The general public, mostly retail investors, hold a substantial 57% stake in BDI, suggesting it is a fairly popular stock. This level of ownership gives retail investors the power to sway key policy decisions such as board composition, executive compensation, and the dividend payout ratio.
Private Equity Ownership
Private equity firms hold a 12% stake in BDI. This suggests they can be influential in key policy decisions. Some might like this, because private equity are sometimes activists who hold management accountable. But other times, private equity is selling out, having taking the company public.
Next Steps:
I find it very interesting to look at who exactly owns a company. But to truly gain insight, we need to consider other information, too.
I always like to check for a history of revenue growth. You can too, by accessing this free chart of historic revenue and earnings in this detailed graph.
If you would prefer discover what analysts are predicting in terms of future growth, do not miss this free report on analyst forecasts.
NB: Figures in this article are calculated using data from the last twelve months, which refer to the 12-month period ending on the last date of the month the financial statement is dated. This may not be consistent with full year annual report figures.
We aim to bring you long-term focused research analysis driven by fundamental data. Note that our analysis may not factor in the latest price-sensitive company announcements or qualitative material.
If you spot an error that warrants correction, please contact the editor at editorial-team@simplywallst.com. This article by Simply Wall St is general in nature. It does not constitute a recommendation to buy or sell any stock, and does not take account of your objectives, or your financial situation. Simply Wall St has no position in the stocks mentioned. Thank you for reading.
