All You Need To Know About FLSmidth & Co. A/S’s (CPH:FLS) Financial Health

Want to participate in a short research study? Help shape the future of investing tools and receive a $20 prize!
Small and large cap stocks are widely popular for a variety of reasons, however, mid-cap companies such as FLSmidth & Co. A/S (CPH:FLS), with a market cap of ø15b, often get neglected by retail investors. Despite this, commonly overlooked mid-caps have historically produced better risk-adjusted returns than their small and large-cap counterparts. FLS’s financial liquidity and debt position will be analysed in this article, to get an idea of whether the company can fund opportunities for strategic growth and maintain strength through economic downturns. Note that this information is centred entirely on financial health and is a top-level understanding, so I encourage you to look further into FLS here.
Check out our latest analysis for FLSmidth
How much cash does FLS generate through its operations?
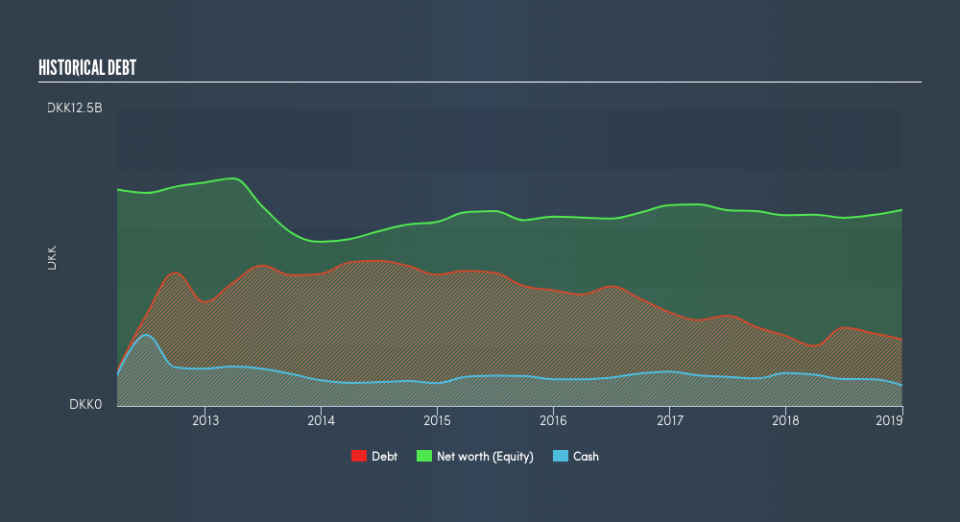
FLS has shrunken its total debt levels in the last twelve months, from ø3.0b to ø2.8b , which includes long-term debt. With this debt payback, FLS’s cash and short-term investments stands at ø875m , ready to deploy into the business. Moreover, FLS has generated ø385m in operating cash flow in the last twelve months, resulting in an operating cash to total debt ratio of 14%, signalling that FLS’s debt is not appropriately covered by operating cash. This ratio can also be interpreted as a measure of efficiency as an alternative to return on assets. In FLS’s case, it is able to generate 0.14x cash from its debt capital.
Can FLS meet its short-term obligations with the cash in hand?
With current liabilities at ø9.5b, it appears that the company has maintained a safe level of current assets to meet its obligations, with the current ratio last standing at 1.24x. Generally, for Construction companies, this is a reasonable ratio since there’s a sufficient cash cushion without leaving too much capital idle or in low-earning investments.
Can FLS service its debt comfortably?
FLS’s level of debt is appropriate relative to its total equity, at 34%. This range is considered safe as FLS is not taking on too much debt obligation, which can be restrictive and risky for equity-holders. We can check to see whether FLS is able to meet its debt obligations by looking at the net interest coverage ratio. A company generating earnings before interest and tax (EBIT) at least three times its net interest payments is considered financially sound. In FLS’s, case, the ratio of 18.8x suggests that interest is comfortably covered, which means that lenders may be less hesitant to lend out more funding as FLS’s high interest coverage is seen as responsible and safe practice.
Next Steps:
Although FLS’s debt level is relatively low, its cash flow levels still could not copiously cover its borrowings. This may indicate room for improvement in terms of its operating efficiency. However, the company exhibits an ability to meet its near term obligations should an adverse event occur. I admit this is a fairly basic analysis for FLS’s financial health. Other important fundamentals need to be considered alongside. You should continue to research FLSmidth to get a more holistic view of the stock by looking at:
Future Outlook: What are well-informed industry analysts predicting for FLS’s future growth? Take a look at our free research report of analyst consensus for FLS’s outlook.
Valuation: What is FLS worth today? Is the stock undervalued, even when its growth outlook is factored into its intrinsic value? The intrinsic value infographic in our free research report helps visualize whether FLS is currently mispriced by the market.
Other High-Performing Stocks: Are there other stocks that provide better prospects with proven track records? Explore our free list of these great stocks here.
We aim to bring you long-term focused research analysis driven by fundamental data. Note that our analysis may not factor in the latest price-sensitive company announcements or qualitative material.
If you spot an error that warrants correction, please contact the editor at editorial-team@simplywallst.com. This article by Simply Wall St is general in nature. It does not constitute a recommendation to buy or sell any stock, and does not take account of your objectives, or your financial situation. Simply Wall St has no position in the stocks mentioned. Thank you for reading.
