Do You Know What Matthews International Corporation's (NASDAQ:MATW) P/E Ratio Means?

Want to participate in a short research study? Help shape the future of investing tools and you could win a $250 gift card!
Today, we'll introduce the concept of the P/E ratio for those who are learning about investing. We'll show how you can use Matthews International Corporation's (NASDAQ:MATW) P/E ratio to inform your assessment of the investment opportunity. Based on the last twelve months, Matthews International's P/E ratio is 14.94. That corresponds to an earnings yield of approximately 6.7%.
Check out our latest analysis for Matthews International
How Do I Calculate A Price To Earnings Ratio?
The formula for price to earnings is:
Price to Earnings Ratio = Share Price ÷ Earnings per Share (EPS)
Or for Matthews International:
P/E of 14.94 = $34.29 ÷ $2.3 (Based on the trailing twelve months to March 2019.)
Is A High Price-to-Earnings Ratio Good?
The higher the P/E ratio, the higher the price tag of a business, relative to its trailing earnings. That isn't necessarily good or bad, but a high P/E implies relatively high expectations of what a company can achieve in the future.
How Growth Rates Impact P/E Ratios
Earnings growth rates have a big influence on P/E ratios. If earnings are growing quickly, then the 'E' in the equation will increase faster than it would otherwise. That means unless the share price increases, the P/E will reduce in a few years. So while a stock may look expensive based on past earnings, it could be cheap based on future earnings.
Matthews International saw earnings per share decrease by 28% last year. But EPS is up 4.0% over the last 5 years.
Does Matthews International Have A Relatively High Or Low P/E For Its Industry?
One good way to get a quick read on what market participants expect of a company is to look at its P/E ratio. The image below shows that Matthews International has a lower P/E than the average (22.8) P/E for companies in the commercial services industry.
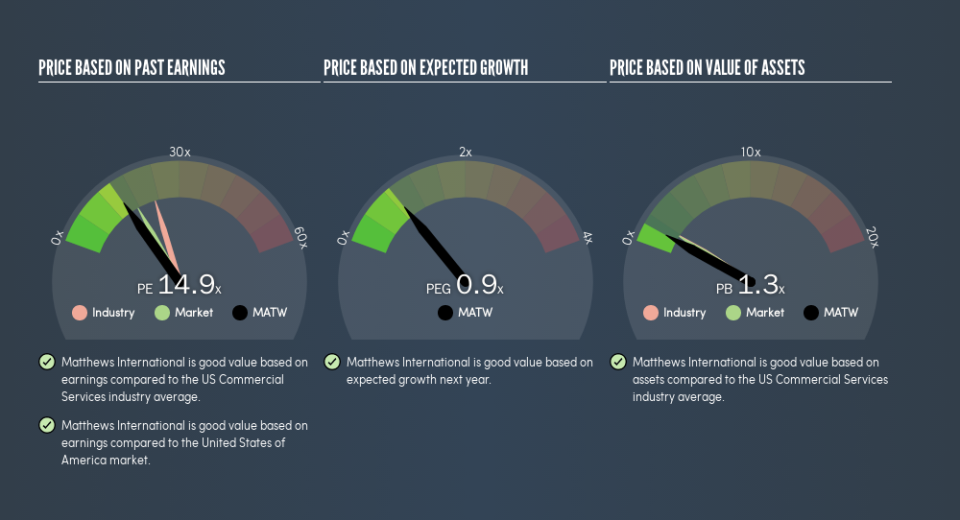
Its relatively low P/E ratio indicates that Matthews International shareholders think it will struggle to do as well as other companies in its industry classification. Since the market seems unimpressed with Matthews International, it's quite possible it could surprise on the upside. You should delve deeper. I like to check if company insiders have been buying or selling.
Don't Forget: The P/E Does Not Account For Debt or Bank Deposits
Don't forget that the P/E ratio considers market capitalization. Thus, the metric does not reflect cash or debt held by the company. Hypothetically, a company could reduce its future P/E ratio by spending its cash (or taking on debt) to achieve higher earnings.
Spending on growth might be good or bad a few years later, but the point is that the P/E ratio does not account for the option (or lack thereof).
So What Does Matthews International's Balance Sheet Tell Us?
Matthews International's net debt is 86% of its market cap. This is a reasonably significant level of debt -- all else being equal you'd expect a much lower P/E than if it had net cash.
The Bottom Line On Matthews International's P/E Ratio
Matthews International trades on a P/E ratio of 14.9, which is below the US market average of 17.3. The P/E reflects market pessimism that probably arises from the lack of recent EPS growth, paired with significant leverage.
Investors should be looking to buy stocks that the market is wrong about. If the reality for a company is not as bad as the P/E ratio indicates, then the share price should increase as the market realizes this. So this free visual report on analyst forecasts could hold the key to an excellent investment decision.
But note: Matthews International may not be the best stock to buy. So take a peek at this free list of interesting companies with strong recent earnings growth (and a P/E ratio below 20).
We aim to bring you long-term focused research analysis driven by fundamental data. Note that our analysis may not factor in the latest price-sensitive company announcements or qualitative material.
If you spot an error that warrants correction, please contact the editor at editorial-team@simplywallst.com. This article by Simply Wall St is general in nature. It does not constitute a recommendation to buy or sell any stock, and does not take account of your objectives, or your financial situation. Simply Wall St has no position in the stocks mentioned. Thank you for reading.
