Do You Know What NWF Group plc’s (LON:NWF) P/E Ratio Means?

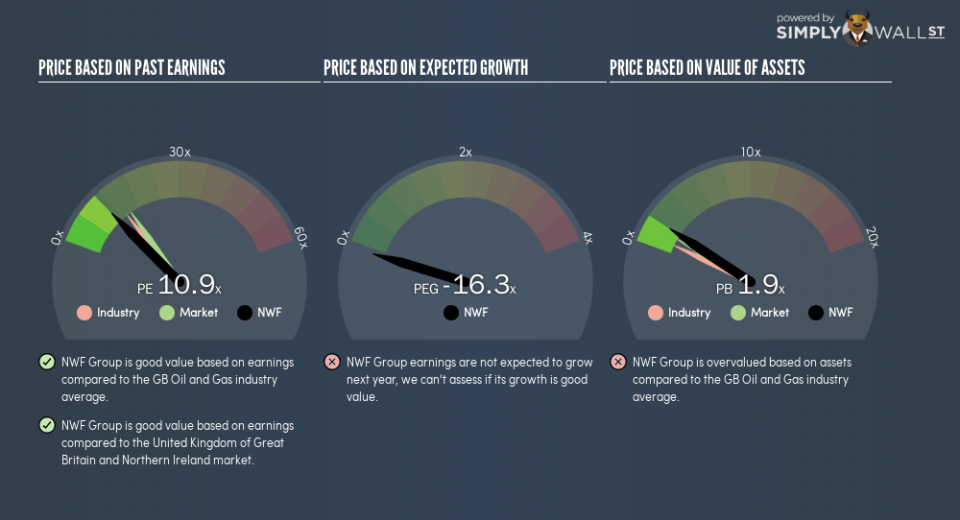
This article is for investors who would like to improve their understanding of price to earnings ratios (P/E ratios). To keep it practical, we’ll show how NWF Group plc’s (LON:NWF) P/E ratio could help you assess the value on offer. NWF Group has a price to earnings ratio of 10.92, based on the last twelve months. That is equivalent to an earnings yield of about 9.2%.
View our latest analysis for NWF Group
How Do I Calculate A Price To Earnings Ratio?
The formula for price to earnings is:
Price to Earnings Ratio = Price per Share ÷ Earnings per Share (EPS)
Or for NWF Group:
P/E of 10.92 = £1.75 ÷ £0.16 (Based on the year to May 2018.)
Is A High Price-to-Earnings Ratio Good?
A higher P/E ratio implies that investors pay a higher price for the earning power of the business. That is not a good or a bad thing per se, but a high P/E does imply buyers are optimistic about the future.
How Growth Rates Impact P/E Ratios
P/E ratios primarily reflect market expectations around earnings growth rates. Earnings growth means that in the future the ‘E’ will be higher. That means even if the current P/E is high, it will reduce over time if the share price stays flat. A lower P/E should indicate the stock is cheap relative to others — and that may attract buyers.
It’s nice to see that NWF Group grew EPS by a stonking 42% in the last year. And earnings per share have improved by 5.9% annually, over the last three years. With that performance, I would expect it to have an above average P/E ratio.
How Does NWF Group’s P/E Ratio Compare To Its Peers?
We can get an indication of market expectations by looking at the P/E ratio. The image below shows that NWF Group has a lower P/E than the average (13.7) P/E for companies in the oil and gas industry.
NWF Group’s P/E tells us that market participants think it will not fare as well as its peers in the same industry. Since the market seems unimpressed with NWF Group, it’s quite possible it could surprise on the upside. If you consider the stock interesting, further research is recommended. For example, I often monitor director buying and selling.
A Limitation: P/E Ratios Ignore Debt and Cash In The Bank
Don’t forget that the P/E ratio considers market capitalization. In other words, it does not consider any debt or cash that the company may have on the balance sheet. Theoretically, a business can improve its earnings (and produce a lower P/E in the future), by taking on debt (or spending its remaining cash).
Spending on growth might be good or bad a few years later, but the point is that the P/E ratio does not account for the option (or lack thereof).
Is Debt Impacting NWF Group’s P/E?
NWF Group has net debt worth just 7.5% of its market capitalization. So it doesn’t have as many options as it would with net cash, but its debt would not have much of an impact on its P/E ratio.
The Verdict On NWF Group’s P/E Ratio
NWF Group’s P/E is 10.9 which is below average (15.1) in the GB market. The EPS growth last year was strong, and debt levels are quite reasonable. If the company can continue to grow earnings, then the current P/E may be unjustifiably low.
Investors have an opportunity when market expectations about a stock are wrong. If it is underestimating a company, investors can make money by buying and holding the shares until the market corrects itself. So this free report on the analyst consensus forecasts could help you make a master move on this stock.
Of course you might be able to find a better stock than NWF Group. So you may wish to see this free collection of other companies that have grown earnings strongly.
To help readers see past the short term volatility of the financial market, we aim to bring you a long-term focused research analysis purely driven by fundamental data. Note that our analysis does not factor in the latest price-sensitive company announcements.
The author is an independent contributor and at the time of publication had no position in the stocks mentioned. For errors that warrant correction please contact the editor at editorial-team@simplywallst.com.
