Do You Know What Silvergate Capital Corporation's (NYSE:SI) P/E Ratio Means?

Today, we'll introduce the concept of the P/E ratio for those who are learning about investing. We'll show how you can use Silvergate Capital Corporation's (NYSE:SI) P/E ratio to inform your assessment of the investment opportunity. What is Silvergate Capital's P/E ratio? Well, based on the last twelve months it is 11.67. That means that at current prices, buyers pay $11.67 for every $1 in trailing yearly profits.
View our latest analysis for Silvergate Capital
How Do I Calculate A Price To Earnings Ratio?
The formula for price to earnings is:
Price to Earnings Ratio = Price per Share ÷ Earnings per Share (EPS)
Or for Silvergate Capital:
P/E of 11.67 = USD16.15 ÷ USD1.38 (Based on the trailing twelve months to December 2019.)
Is A High Price-to-Earnings Ratio Good?
The higher the P/E ratio, the higher the price tag of a business, relative to its trailing earnings. That isn't a good or a bad thing on its own, but a high P/E means that buyers have a higher opinion of the business's prospects, relative to stocks with a lower P/E.
Does Silvergate Capital Have A Relatively High Or Low P/E For Its Industry?
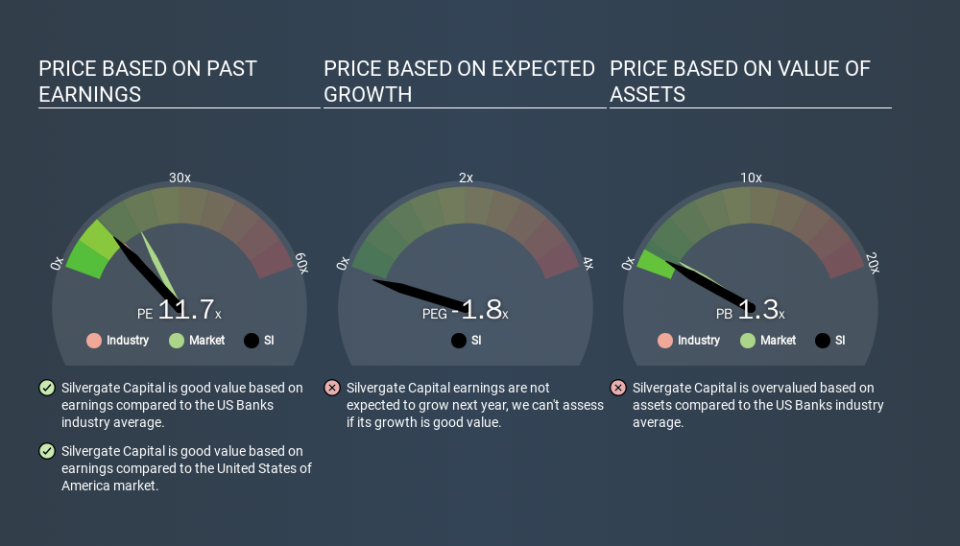
One good way to get a quick read on what market participants expect of a company is to look at its P/E ratio. The image below shows that Silvergate Capital has a P/E ratio that is roughly in line with the banks industry average (12.6).
Its P/E ratio suggests that Silvergate Capital shareholders think that in the future it will perform about the same as other companies in its industry classification. So if Silvergate Capital actually outperforms its peers going forward, that should be a positive for the share price. Further research into factors such as insider buying and selling, could help you form your own view on whether that is likely.
How Growth Rates Impact P/E Ratios
P/E ratios primarily reflect market expectations around earnings growth rates. When earnings grow, the 'E' increases, over time. Therefore, even if you pay a high multiple of earnings now, that multiple will become lower in the future. So while a stock may look expensive based on past earnings, it could be cheap based on future earnings.
Silvergate Capital's earnings per share grew by -2.5% in the last twelve months. And earnings per share have improved by 14% annually, over the last five years.
Remember: P/E Ratios Don't Consider The Balance Sheet
Don't forget that the P/E ratio considers market capitalization. In other words, it does not consider any debt or cash that the company may have on the balance sheet. In theory, a company can lower its future P/E ratio by using cash or debt to invest in growth.
Spending on growth might be good or bad a few years later, but the point is that the P/E ratio does not account for the option (or lack thereof).
So What Does Silvergate Capital's Balance Sheet Tell Us?
Silvergate Capital has net cash of US$89m. This is fairly high at 29% of its market capitalization. That might mean balance sheet strength is important to the business, but should also help push the P/E a bit higher than it would otherwise be.
The Bottom Line On Silvergate Capital's P/E Ratio
Silvergate Capital has a P/E of 11.7. That's below the average in the US market, which is 18.6. Earnings improved over the last year. And the healthy balance sheet means the company can sustain growth while the P/E suggests shareholders don't think it will.
Investors should be looking to buy stocks that the market is wrong about. As value investor Benjamin Graham famously said, 'In the short run, the market is a voting machine but in the long run, it is a weighing machine. So this free report on the analyst consensus forecasts could help you make a master move on this stock.
You might be able to find a better buy than Silvergate Capital. If you want a selection of possible winners, check out this free list of interesting companies that trade on a P/E below 20 (but have proven they can grow earnings).
If you spot an error that warrants correction, please contact the editor at editorial-team@simplywallst.com. This article by Simply Wall St is general in nature. It does not constitute a recommendation to buy or sell any stock, and does not take account of your objectives, or your financial situation. Simply Wall St has no position in the stocks mentioned.
We aim to bring you long-term focused research analysis driven by fundamental data. Note that our analysis may not factor in the latest price-sensitive company announcements or qualitative material. Thank you for reading.
