Do You Know What TransAlta Renewables Inc.'s (TSE:RNW) P/E Ratio Means?

This article is written for those who want to get better at using price to earnings ratios (P/E ratios). We'll apply a basic P/E ratio analysis to TransAlta Renewables Inc.'s (TSE:RNW), to help you decide if the stock is worth further research. Based on the last twelve months, TransAlta Renewables's P/E ratio is 18.57. In other words, at today's prices, investors are paying CA$18.57 for every CA$1 in prior year profit.
See our latest analysis for TransAlta Renewables
How Do You Calculate A P/E Ratio?
The formula for P/E is:
Price to Earnings Ratio = Price per Share ÷ Earnings per Share (EPS)
Or for TransAlta Renewables:
P/E of 18.57 = CAD15.77 ÷ CAD0.85 (Based on the year to September 2019.)
Is A High P/E Ratio Good?
A higher P/E ratio means that investors are paying a higher price for each CAD1 of company earnings. That isn't necessarily good or bad, but a high P/E implies relatively high expectations of what a company can achieve in the future.
How Does TransAlta Renewables's P/E Ratio Compare To Its Peers?
We can get an indication of market expectations by looking at the P/E ratio. The image below shows that TransAlta Renewables has a P/E ratio that is roughly in line with the renewable energy industry average (18.8).
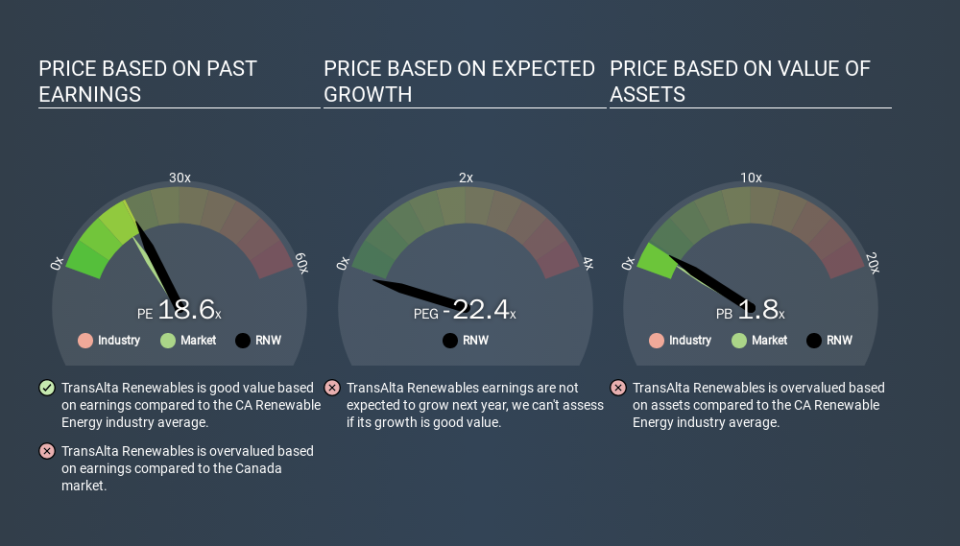
TransAlta Renewables's P/E tells us that market participants think its prospects are roughly in line with its industry. So if TransAlta Renewables actually outperforms its peers going forward, that should be a positive for the share price. Checking factors such as director buying and selling. could help you form your own view on if that will happen.
How Growth Rates Impact P/E Ratios
Generally speaking the rate of earnings growth has a profound impact on a company's P/E multiple. Earnings growth means that in the future the 'E' will be higher. And in that case, the P/E ratio itself will drop rather quickly. So while a stock may look expensive based on past earnings, it could be cheap based on future earnings.
TransAlta Renewables increased earnings per share by an impressive 22% over the last twelve months. And its annual EPS growth rate over 5 years is 18%. With that performance, you might expect an above average P/E ratio.
A Limitation: P/E Ratios Ignore Debt and Cash In The Bank
The 'Price' in P/E reflects the market capitalization of the company. Thus, the metric does not reflect cash or debt held by the company. Theoretically, a business can improve its earnings (and produce a lower P/E in the future) by investing in growth. That means taking on debt (or spending its cash).
Such spending might be good or bad, overall, but the key point here is that you need to look at debt to understand the P/E ratio in context.
TransAlta Renewables's Balance Sheet
TransAlta Renewables has net debt worth 21% of its market capitalization. It would probably deserve a higher P/E ratio if it was net cash, since it would have more options for growth.
The Bottom Line On TransAlta Renewables's P/E Ratio
TransAlta Renewables's P/E is 18.6 which is above average (15.8) in its market. Its debt levels do not imperil its balance sheet and it is growing EPS strongly. Therefore, it's not particularly surprising that it has a above average P/E ratio.
Investors have an opportunity when market expectations about a stock are wrong. People often underestimate remarkable growth -- so investors can make money when fast growth is not fully appreciated. So this free report on the analyst consensus forecasts could help you make a master move on this stock.
Of course you might be able to find a better stock than TransAlta Renewables. So you may wish to see this free collection of other companies that have grown earnings strongly.
If you spot an error that warrants correction, please contact the editor at editorial-team@simplywallst.com. This article by Simply Wall St is general in nature. It does not constitute a recommendation to buy or sell any stock, and does not take account of your objectives, or your financial situation. Simply Wall St has no position in the stocks mentioned.
We aim to bring you long-term focused research analysis driven by fundamental data. Note that our analysis may not factor in the latest price-sensitive company announcements or qualitative material. Thank you for reading.
