Kogan.com Ltd (ASX:KGN) surges 18%; individual investors who own 44% shares profited along with institutions
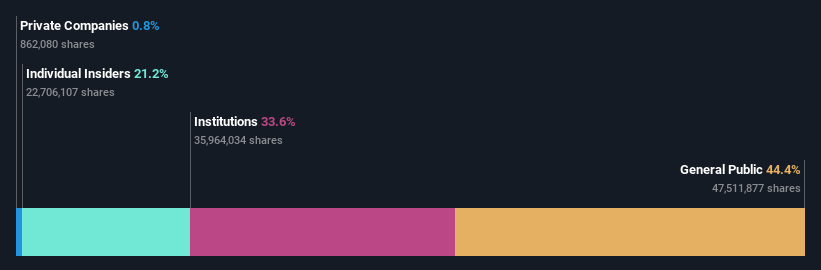
A look at the shareholders of Kogan.com Ltd (ASX:KGN) can tell us which group is most powerful. We can see that individual investors own the lion's share in the company with 44% ownership. That is, the group stands to benefit the most if the stock rises (or lose the most if there is a downturn).
While individual investors were the group that reaped the most benefits after last week’s 18% price gain, institutions also received a 34% cut.
In the chart below, we zoom in on the different ownership groups of Kogan.com.
Check out our latest analysis for Kogan.com
What Does The Institutional Ownership Tell Us About Kogan.com?
Many institutions measure their performance against an index that approximates the local market. So they usually pay more attention to companies that are included in major indices.
As you can see, institutional investors have a fair amount of stake in Kogan.com. This can indicate that the company has a certain degree of credibility in the investment community. However, it is best to be wary of relying on the supposed validation that comes with institutional investors. They too, get it wrong sometimes. It is not uncommon to see a big share price drop if two large institutional investors try to sell out of a stock at the same time. So it is worth checking the past earnings trajectory of Kogan.com, (below). Of course, keep in mind that there are other factors to consider, too.

We note that hedge funds don't have a meaningful investment in Kogan.com. Looking at our data, we can see that the largest shareholder is the CEO Ruslan Kogan with 15% of shares outstanding. The second and third largest shareholders are Hosking Partners LLP and BlackRock, Inc., with an equal amount of shares to their name at 5.0%.
A closer look at our ownership figures suggests that the top 11 shareholders have a combined ownership of 51% implying that no single shareholder has a majority.
While it makes sense to study institutional ownership data for a company, it also makes sense to study analyst sentiments to know which way the wind is blowing. Quite a few analysts cover the stock, so you could look into forecast growth quite easily.
Insider Ownership Of Kogan.com
The definition of company insiders can be subjective and does vary between jurisdictions. Our data reflects individual insiders, capturing board members at the very least. Management ultimately answers to the board. However, it is not uncommon for managers to be executive board members, especially if they are a founder or the CEO.
Insider ownership is positive when it signals leadership are thinking like the true owners of the company. However, high insider ownership can also give immense power to a small group within the company. This can be negative in some circumstances.
Our most recent data indicates that insiders own a reasonable proportion of Kogan.com Ltd. Insiders have a AU$88m stake in this AU$413m business. This may suggest that the founders still own a lot of shares. You can click here to see if they have been buying or selling.
General Public Ownership
With a 44% ownership, the general public, mostly comprising of individual investors, have some degree of sway over Kogan.com. While this group can't necessarily call the shots, it can certainly have a real influence on how the company is run.
Next Steps:
While it is well worth considering the different groups that own a company, there are other factors that are even more important.
I like to dive deeper into how a company has performed in the past. You can find historic revenue and earnings in this detailed graph.
If you are like me, you may want to think about whether this company will grow or shrink. Luckily, you can check this free report showing analyst forecasts for its future.
NB: Figures in this article are calculated using data from the last twelve months, which refer to the 12-month period ending on the last date of the month the financial statement is dated. This may not be consistent with full year annual report figures.
Have feedback on this article? Concerned about the content? Get in touch with us directly. Alternatively, email editorial-team (at) simplywallst.com.
This article by Simply Wall St is general in nature. We provide commentary based on historical data and analyst forecasts only using an unbiased methodology and our articles are not intended to be financial advice. It does not constitute a recommendation to buy or sell any stock, and does not take account of your objectives, or your financial situation. We aim to bring you long-term focused analysis driven by fundamental data. Note that our analysis may not factor in the latest price-sensitive company announcements or qualitative material. Simply Wall St has no position in any stocks mentioned.
Join A Paid User Research Session
You’ll receive a US$30 Amazon Gift card for 1 hour of your time while helping us build better investing tools for the individual investors like yourself. Sign up here
