Is Lam Research Corporation's (NASDAQ:LRCX) Balance Sheet Strong Enough To Weather A Storm?

Want to participate in a short research study? Help shape the future of investing tools and you could win a $250 gift card!
Lam Research Corporation (NASDAQ:LRCX), a large-cap worth US$30b, comes to mind for investors seeking a strong and reliable stock investment. Big corporations are much sought after by risk-averse investors who find diversified revenue streams and strong capital returns attractive. However, the health of the financials determines whether the company continues to succeed. This article will examine Lam Research’s financial liquidity and debt levels to get an idea of whether the company can deal with cyclical downturns and maintain funds to accommodate strategic spending for future growth. Note that this commentary is very high-level and solely focused on financial health, so I suggest you dig deeper yourself into LRCX here.
View our latest analysis for Lam Research
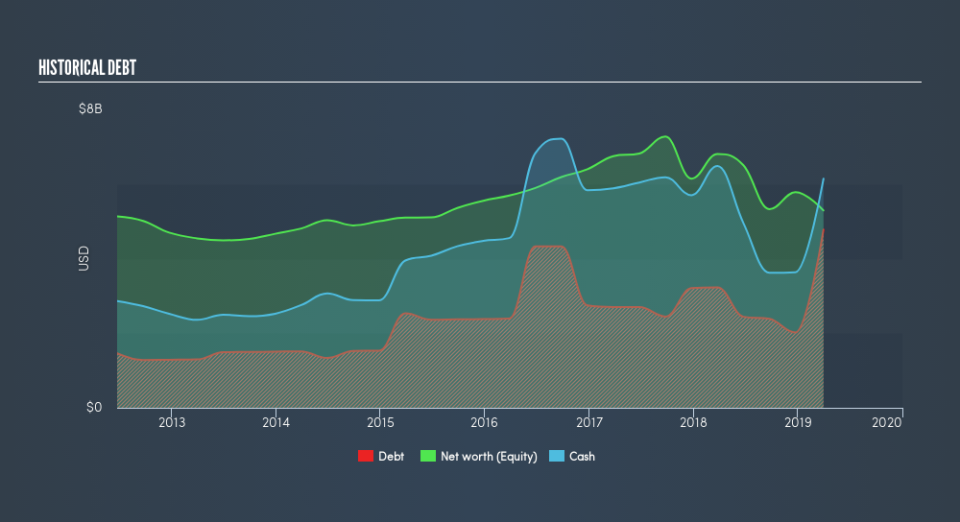
LRCX’s Debt (And Cash Flows)
LRCX has built up its total debt levels in the last twelve months, from US$3.2b to US$4.8b , which accounts for long term debt. With this increase in debt, the current cash and short-term investment levels stands at US$6.1b to keep the business going. Moreover, LRCX has produced cash from operations of US$3.0b during the same period of time, resulting in an operating cash to total debt ratio of 63%, indicating that LRCX’s operating cash is sufficient to cover its debt.
Can LRCX pay its short-term liabilities?
Looking at LRCX’s US$2.8b in current liabilities, it appears that the company has been able to meet these obligations given the level of current assets of US$9.4b, with a current ratio of 3.37x. The current ratio is the number you get when you divide current assets by current liabilities. Having said that, a ratio above 3x may be considered excessive by some investors, yet this is not usually a major negative for a company.
Does LRCX face the risk of succumbing to its debt-load?
With a debt-to-equity ratio of 90%, LRCX can be considered as an above-average leveraged company. This isn’t surprising for large-caps, as equity can often be more expensive to issue than debt, plus interest payments are tax deductible. Accordingly, large companies often have an advantage over small-caps through lower cost of capital due to cheaper financing. We can check to see whether LRCX is able to meet its debt obligations by looking at the net interest coverage ratio. A company generating earnings before interest and tax (EBIT) at least three times its net interest payments is considered financially sound. In LRCX's case, the ratio of 302x suggests that interest is amply covered. High interest coverage is seen as a responsible and safe practice, which highlights why most investors believe large-caps such as LRCX is a safe investment.
Next Steps:
LRCX’s high cash coverage means that, although its debt levels are high, the company is able to utilise its borrowings efficiently in order to generate cash flow. This may mean this is an optimal capital structure for the business, given that it is also meeting its short-term commitment. I admit this is a fairly basic analysis for LRCX's financial health. Other important fundamentals need to be considered alongside. I suggest you continue to research Lam Research to get a more holistic view of the large-cap by looking at:
Future Outlook: What are well-informed industry analysts predicting for LRCX’s future growth? Take a look at our free research report of analyst consensus for LRCX’s outlook.
Valuation: What is LRCX worth today? Is the stock undervalued, even when its growth outlook is factored into its intrinsic value? The intrinsic value infographic in our free research report helps visualize whether LRCX is currently mispriced by the market.
Other High-Performing Stocks: Are there other stocks that provide better prospects with proven track records? Explore our free list of these great stocks here.
We aim to bring you long-term focused research analysis driven by fundamental data. Note that our analysis may not factor in the latest price-sensitive company announcements or qualitative material.
If you spot an error that warrants correction, please contact the editor at editorial-team@simplywallst.com. This article by Simply Wall St is general in nature. It does not constitute a recommendation to buy or sell any stock, and does not take account of your objectives, or your financial situation. Simply Wall St has no position in the stocks mentioned. Thank you for reading.
