What Is Laserbond's (ASX:LBL) P/E Ratio After Its Share Price Rocketed?

Laserbond (ASX:LBL) shares have continued recent momentum with a 57% gain in the last month alone. Zooming out, the stock's 445% gain in the last year is certainly splendiferous.
Assuming no other changes, a sharply higher share price makes a stock less attractive to potential buyers. While the market sentiment towards a stock is very changeable, in the long run, the share price will tend to move in the same direction as earnings per share. The implication here is that deep value investors might steer clear when expectations of a company are too high. One way to gauge market expectations of a stock is to look at its Price to Earnings Ratio (PE Ratio). A high P/E ratio means that investors have a high expectation about future growth, while a low P/E ratio means they have low expectations about future growth.
Check out our latest analysis for Laserbond
How Does Laserbond's P/E Ratio Compare To Its Peers?
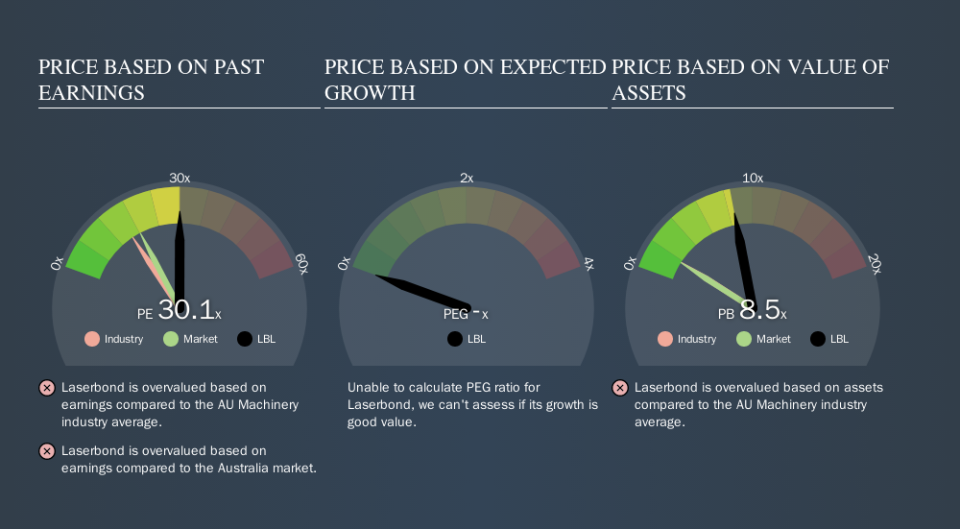
We can tell from its P/E ratio of 30.08 that there is some investor optimism about Laserbond. You can see in the image below that the average P/E (15.7) for companies in the machinery industry is lower than Laserbond's P/E.
Laserbond's P/E tells us that market participants think the company will perform better than its industry peers, going forward. Clearly the market expects growth, but it isn't guaranteed. So further research is always essential. I often monitor director buying and selling.
How Growth Rates Impact P/E Ratios
Earnings growth rates have a big influence on P/E ratios. Earnings growth means that in the future the 'E' will be higher. That means even if the current P/E is high, it will reduce over time if the share price stays flat. And as that P/E ratio drops, the company will look cheap, unless its share price increases.
In the last year, Laserbond grew EPS like Taylor Swift grew her fan base back in 2010; the 188% gain was both fast and well deserved. The cherry on top is that the five year growth rate was an impressive 32% per year. So I'd be surprised if the P/E ratio was not above average.
Don't Forget: The P/E Does Not Account For Debt or Bank Deposits
One drawback of using a P/E ratio is that it considers market capitalization, but not the balance sheet. That means it doesn't take debt or cash into account. Hypothetically, a company could reduce its future P/E ratio by spending its cash (or taking on debt) to achieve higher earnings.
Spending on growth might be good or bad a few years later, but the point is that the P/E ratio does not account for the option (or lack thereof).
Is Debt Impacting Laserbond's P/E?
The extra options and safety that comes with Laserbond's AU$2.2m net cash position means that it deserves a higher P/E than it would if it had a lot of net debt.
The Bottom Line On Laserbond's P/E Ratio
Laserbond's P/E is 30.1 which is above average (18.2) in its market. The excess cash it carries is the gravy on top its fast EPS growth. So based on this analysis we'd expect Laserbond to have a high P/E ratio. What we know for sure is that investors have become much more excited about Laserbond recently, since they have pushed its P/E ratio from 19.2 to 30.1 over the last month. For those who prefer to invest with the flow of momentum, that might mean it's time to put the stock on a watchlist, or research it. But the contrarian may see it as a missed opportunity.
Investors should be looking to buy stocks that the market is wrong about. If the reality for a company is better than it expects, you can make money by buying and holding for the long term. Although we don't have analyst forecasts you might want to assess this data-rich visualization of earnings, revenue and cash flow.
But note: Laserbond may not be the best stock to buy. So take a peek at this free list of interesting companies with strong recent earnings growth (and a P/E ratio below 20).
We aim to bring you long-term focused research analysis driven by fundamental data. Note that our analysis may not factor in the latest price-sensitive company announcements or qualitative material.
If you spot an error that warrants correction, please contact the editor at editorial-team@simplywallst.com. This article by Simply Wall St is general in nature. It does not constitute a recommendation to buy or sell any stock, and does not take account of your objectives, or your financial situation. Simply Wall St has no position in the stocks mentioned. Thank you for reading.
