What Can We Learn From CRH Medical Corporation’s (TSE:CRH) Investment Returns?

Want to participate in a short research study? Help shape the future of investing tools and you could win a $250 gift card!
Today we'll evaluate CRH Medical Corporation (TSE:CRH) to determine whether it could have potential as an investment idea. To be precise, we'll consider its Return On Capital Employed (ROCE), as that will inform our view of the quality of the business.
First up, we'll look at what ROCE is and how we calculate it. Second, we'll look at its ROCE compared to similar companies. Finally, we'll look at how its current liabilities affect its ROCE.
What is Return On Capital Employed (ROCE)?
ROCE is a metric for evaluating how much pre-tax income (in percentage terms) a company earns on the capital invested in its business. In general, businesses with a higher ROCE are usually better quality. Overall, it is a valuable metric that has its flaws. Author Edwin Whiting says to be careful when comparing the ROCE of different businesses, since 'No two businesses are exactly alike.'
How Do You Calculate Return On Capital Employed?
The formula for calculating the return on capital employed is:
Return on Capital Employed = Earnings Before Interest and Tax (EBIT) ÷ (Total Assets - Current Liabilities)
Or for CRH Medical:
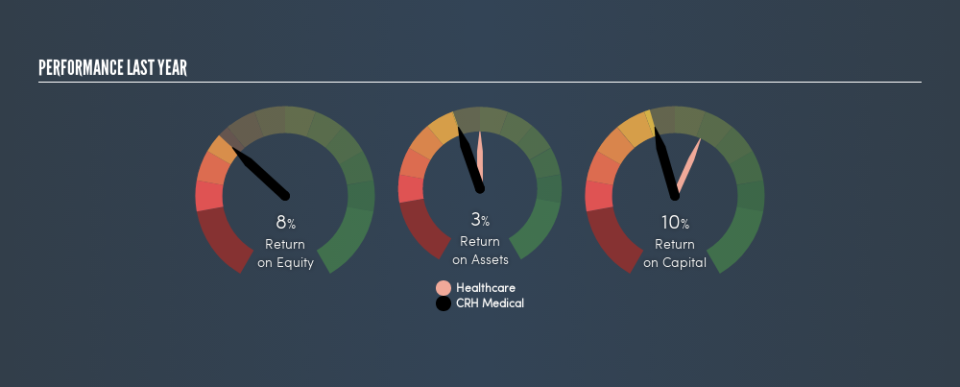
0.10 = US$20m ÷ (US$212m - US$15m) (Based on the trailing twelve months to March 2019.)
Therefore, CRH Medical has an ROCE of 10%.
Check out our latest analysis for CRH Medical
Is CRH Medical's ROCE Good?
One way to assess ROCE is to compare similar companies. It appears that CRH Medical's ROCE is fairly close to the Healthcare industry average of 10%. Separate from CRH Medical's performance relative to its industry, its ROCE in absolute terms looks satisfactory, and it may be worth researching in more depth.
CRH Medical's current ROCE of 10% is lower than 3 years ago, when the company reported a 15% ROCE. This makes us wonder if the business is facing new challenges.
It is important to remember that ROCE shows past performance, and is not necessarily predictive. ROCE can be deceptive for cyclical businesses, as returns can look incredible in boom times, and terribly low in downturns. This is because ROCE only looks at one year, instead of considering returns across a whole cycle. Since the future is so important for investors, you should check out our free report on analyst forecasts for CRH Medical.
CRH Medical's Current Liabilities And Their Impact On Its ROCE
Current liabilities include invoices, such as supplier payments, short-term debt, or a tax bill, that need to be paid within 12 months. The ROCE equation subtracts current liabilities from capital employed, so a company with a lot of current liabilities appears to have less capital employed, and a higher ROCE than otherwise. To check the impact of this, we calculate if a company has high current liabilities relative to its total assets.
CRH Medical has total liabilities of US$15m and total assets of US$212m. Therefore its current liabilities are equivalent to approximately 7.0% of its total assets. Low current liabilities have only a minimal impact on CRH Medical's ROCE, making its decent returns more credible.
What We Can Learn From CRH Medical's ROCE
This is good to see, and while better prospects may exist, CRH Medical seems worth researching further. CRH Medical shapes up well under this analysis, but it is far from the only business delivering excellent numbers . You might also want to check this free collection of companies delivering excellent earnings growth.
If you are like me, then you will not want to miss this free list of growing companies that insiders are buying.
We aim to bring you long-term focused research analysis driven by fundamental data. Note that our analysis may not factor in the latest price-sensitive company announcements or qualitative material.
If you spot an error that warrants correction, please contact the editor at editorial-team@simplywallst.com. This article by Simply Wall St is general in nature. It does not constitute a recommendation to buy or sell any stock, and does not take account of your objectives, or your financial situation. Simply Wall St has no position in the stocks mentioned. Thank you for reading.
