Is Lendway Inc (LDWY) a Value Investment or a Value Trap? An In-Depth Analysis
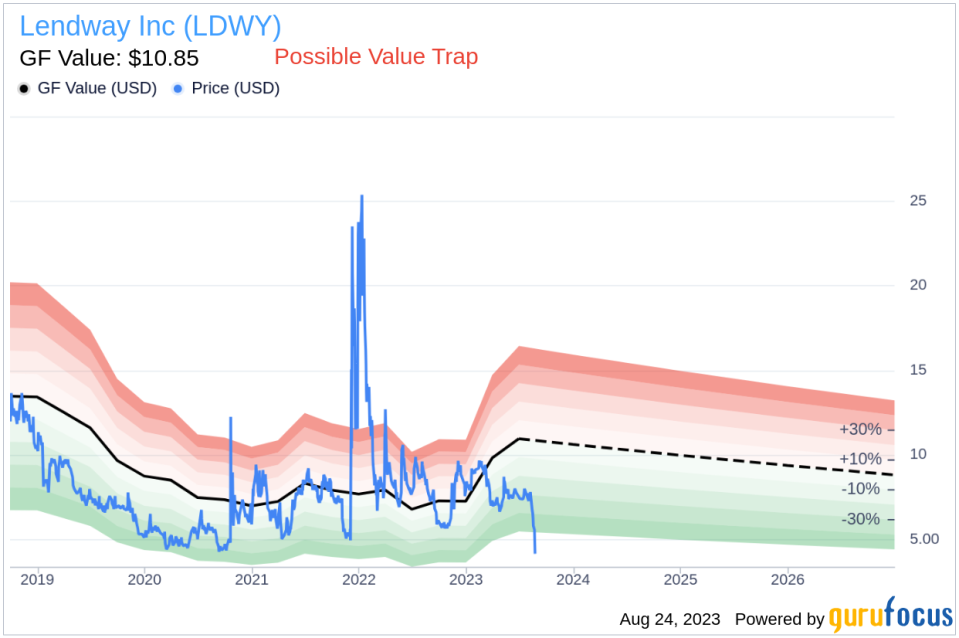
Value-focused investors are always on the hunt for stocks that are priced below their intrinsic value. One such stock that merits attention is Lendway Inc (NASDAQ:LDWY). The stock, which is currently priced at 4.15, recorded a loss of 24.56% in a day and a 3-month decrease of 47.86%. The stock's fair valuation is $10.85, as indicated by its GF Value.
Understanding GF Value
The GF Value represents the current intrinsic value of a stock derived from our exclusive method. The GF Value Line on our summary page gives an overview of the fair value that the stock should be traded at. It is calculated based on three factors:
Historical multiples (PE Ratio, PS Ratio, PB Ratio and Price-to-Free-Cash-Flow) that the stock has traded at.
GuruFocus adjustment factor based on the company's past returns and growth.
Future estimates of the business performance.
We believe the GF Value Line is the fair value that the stock should be traded at. The stock price will most likely fluctuate around the GF Value Line. If the stock price is significantly above the GF Value Line, it is overvalued and its future return is likely to be poor. On the other hand, if it is significantly below the GF Value Line, its future return will likely be higher.
Considering Risk Factors
However, investors need to consider a more in-depth analysis before making an investment decision. Despite its seemingly attractive valuation, certain risk factors associated with Lendway should not be ignored. These risks are primarily reflected through its low Beneish M-Score of 0 that exceeds -1.78, the threshold for potential earnings manipulation. Additionally, the company's revenues and earnings have been on a downward trend over the past five years, which raises a crucial question: Is Lendway a hidden gem or a value trap?
Interpreting the Beneish M-Score
Developed by Professor Messod Beneish, the Beneish M-Score is based on eight financial variables that reflect different aspects of a company's financial performance and position. These are Days Sales Outstanding (DSO), Gross Margin (GM), Total Long-term Assets Less Property, Plant and Equipment over Total Assets (TATA), change in Revenue (?REV), change in Depreciation and Amortization (?DA), change in Selling, General and Admin expenses (?SGA), change in Debt-to-Asset Ratio (?LVG), and Net Income Less Non-Operating Income and Cash Flow from Operations over Total Assets (?NOATA).
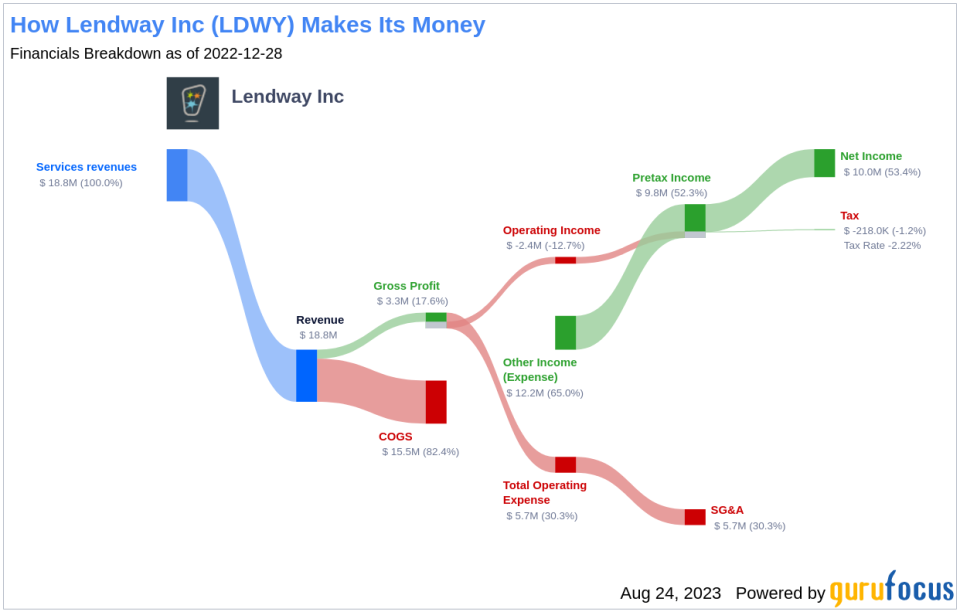
Company Overview
Lendway Inc, formerly Insignia Systems Inc, offers in-store and digital advertising solutions to consumer-packaged goods manufacturers, retailers, shopper marketing agencies, and brokerages. It offers custom design, printing, and store signage programs directly to retailers that seek effective ways to communicate with their shoppers in the store. The company's products include the Insignia Point-of-Purchase Services (POPS) in-store marketing program, Laser printable cardstock, and Label supplies. The company shelf-edge advertising and promotion tactic. The program allows manufacturers to deliver product information to consumers at the point-of-purchase. The company also provides marketing solutions to brands spanning from some of the largest multinationals to new and emerging brands.
Evaluating Financial Metrics
The days sales outstanding (DSO) is an important financial metric that denotes the average time a company takes to collect payment after a sale is completed. Looking at the historical data from the past three years (2021: 1.55; 2022: 1.83; 2023: 1.58), there appears to be a recent surge following an initial decline in Lendway's DSO.
The Gross Margin index tracks the evolution of a company's gross profit as a proportion of its revenue. A downward trend could indicate issues such as overproduction or more generous credit terms, both of which are potential red flags for earnings manipulation. By examining the past three years of Lendway's historical data (2021: 17.79; 2022: 16.02; 2023: 21.62), we find that its Gross Margin has contracted by 3.5%.
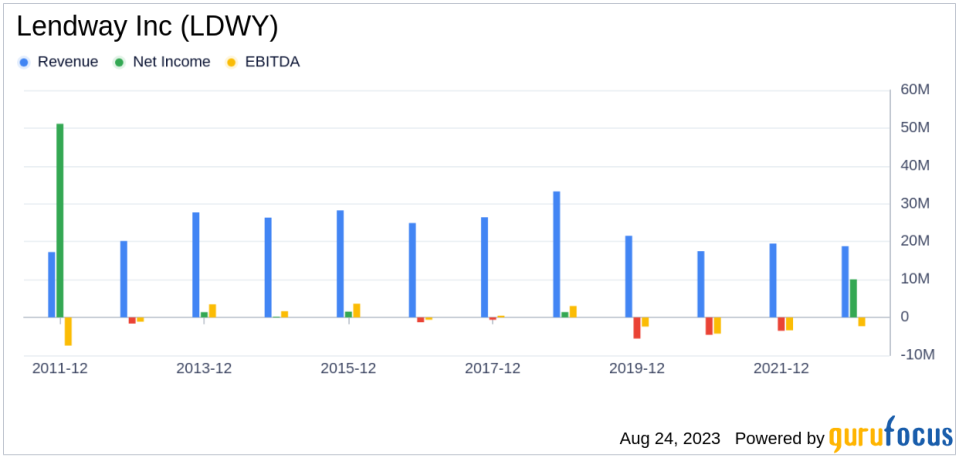
Declining Revenues and Earnings
One of the telltale indicators of a company's potential trouble is a sustained decline in revenues. In the case of Lendway, both the revenue per share (evident from the last five years' TTM data: 2019: 16.74; 2020: 10.78; 2021: 11.99; 2022: 9.78; 2023: 15.81; ) and the 5-year revenue growth rate (-10.7%) have been on a consistent downward trajectory.
Conclusion
Despite its low price-to-fair-value ratio, Lendway's falling revenues and earnings cast a long shadow over its investment attractiveness. Without a clear turnaround strategy, there's a risk that the company's performance could continue to deteriorate, leading to further price declines. In such a scenario, the low price-to-GF-Value ratio may be more indicative of a value trap than a value opportunity.
To find out the high quality companies that may deliever above average returns, please check out GuruFocus High Quality Low Capex Screener.Investors can find stocks with good revenue and earnings growth using GuruFocus' Peter Lynch Growth with Low Valuation Screener.
This article first appeared on GuruFocus.
