Lennox International Inc (LII): A Comprehensive GF Score Analysis
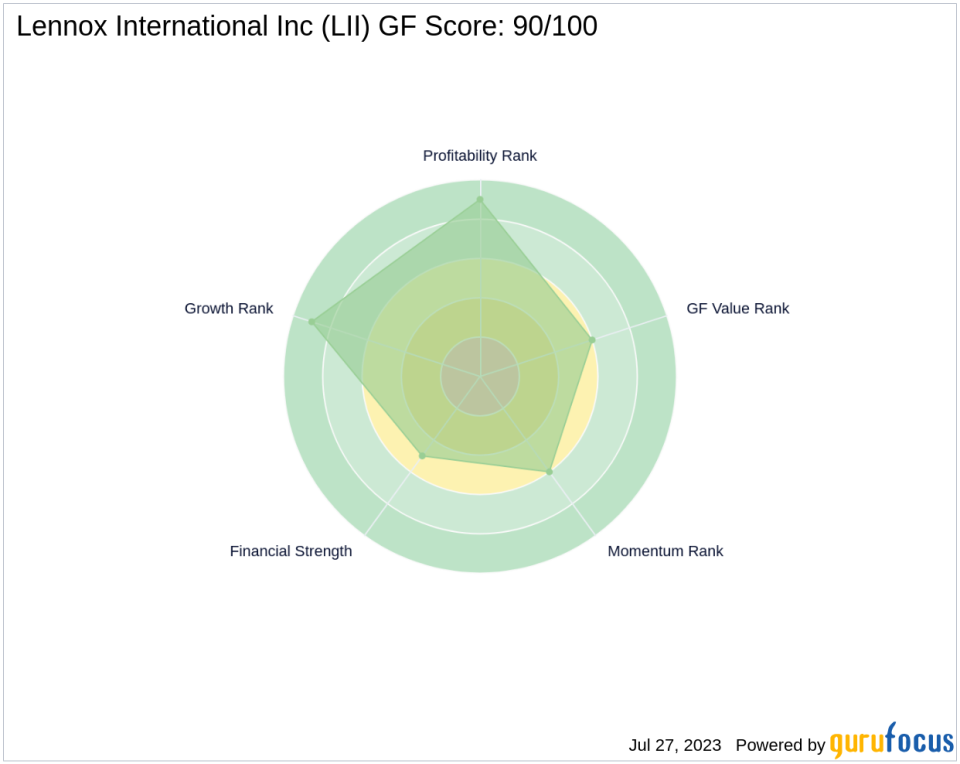
Lennox International Inc (NYSE:LII), a prominent player in the construction industry, is currently trading at $352.1 with a market capitalization of $12.5 billion. The company's stock has seen a gain of 4.79% today and an impressive 9.83% over the past four weeks. In this article, we will delve into the company's GF Score of 90/100, a stock performance ranking system developed by GuruFocus. This score is based on five key aspects of valuation and is closely correlated with the long-term performance of stocks. A higher GF Score generally indicates higher returns.
Financial Strength Analysis
Lennox International Inc's Financial Strength rank stands at 5/10. This rank measures the robustness of a company's financial situation, considering factors such as its debt burden, debt to revenue ratio, and Altman Z-Score. Lennox's interest coverage is 14.55, indicating a comfortable ability to cover its interest expenses. The company's debt to revenue ratio is 0.40, suggesting a moderate level of debt relative to its revenue. Furthermore, its Altman Z-Score of 6.65 indicates a low probability of financial distress.
Profitability Rank Analysis
The company's Profitability Rank is 9/10, reflecting its strong profitability. The rank is based on factors such as operating margin, Piotroski F-Score, the trend of the operating margin, consistency of profitability, and predictability rank. Lennox's operating margin is 14.41%, and its Piotroski F-Score is 4, indicating a stable financial situation. The company has shown consistent profitability over the past 10 years, with a 5-year average operating margin trend of 2.20%.
Growth Rank Analysis
Lennox International Inc's Growth Rank is 9/10, reflecting strong revenue and profitability growth. The company's 5-year revenue growth rate is 7.10%, and its 3-year revenue growth rate is 10.90%. Additionally, its 5-year EBITDA growth rate is 8.40%, indicating a steady increase in its earnings before interest, taxes, depreciation, and amortization.
GF Value Rank Analysis
The company's GF Value Rank is 6/10, determined by the price-to-GF-Value ratio. This proprietary metric is calculated based on historical multiples, along with an adjustment factor based on a company's past returns and growth, and future estimates of the business' performance.
Momentum Rank Analysis
Lennox International Inc's Momentum Rank is 6/10, determined using the standardized momentum ratio and other momentum indicators. This rank reflects the company's stock price performance and is indicative of its future potential.
Competitor Analysis
Lennox International Inc's main competitors in the construction industry are Owens-Corning Inc (NYSE:OC), Carlisle Companies Inc (NYSE:CSL), and Masco Corp (NYSE:MAS). Owens-Corning Inc has a GF Score of 87, Carlisle Companies Inc has a GF Score of 91, and Masco Corp has a GF Score of 90. This comparison indicates that Lennox International Inc is performing well within its industry.
Conclusion
In conclusion, Lennox International Inc's overall GF Score of 90/100 suggests a high potential for outperformance. The company's strong financial strength, profitability, growth, and momentum, coupled with its competitive GF Value Rank, make it a compelling consideration for investors. However, as with any investment, it's crucial to conduct thorough research and consider the company's overall financial health and market conditions before making an investment decision.
This article first appeared on GuruFocus.
