LG Display Co Ltd (LPL): A Deep Dive into Its Performance Challenges
Long-established in the Hardware industry, LG Display Co Ltd (NYSE:LPL) has enjoyed a stellar reputation. However, it has recently witnessed a daily loss of 5.49%, juxtaposed with a three-month change of -27.04%. Fresh insights from the GF Score hint at potential headwinds. Notably, its diminished rankings in financial strength, growth, and valuation suggest that the company might not live up to its historical performance. Join us as we dive deep into these pivotal metrics to unravel the evolving narrative of LG Display Co Ltd.
Understanding the GF Score
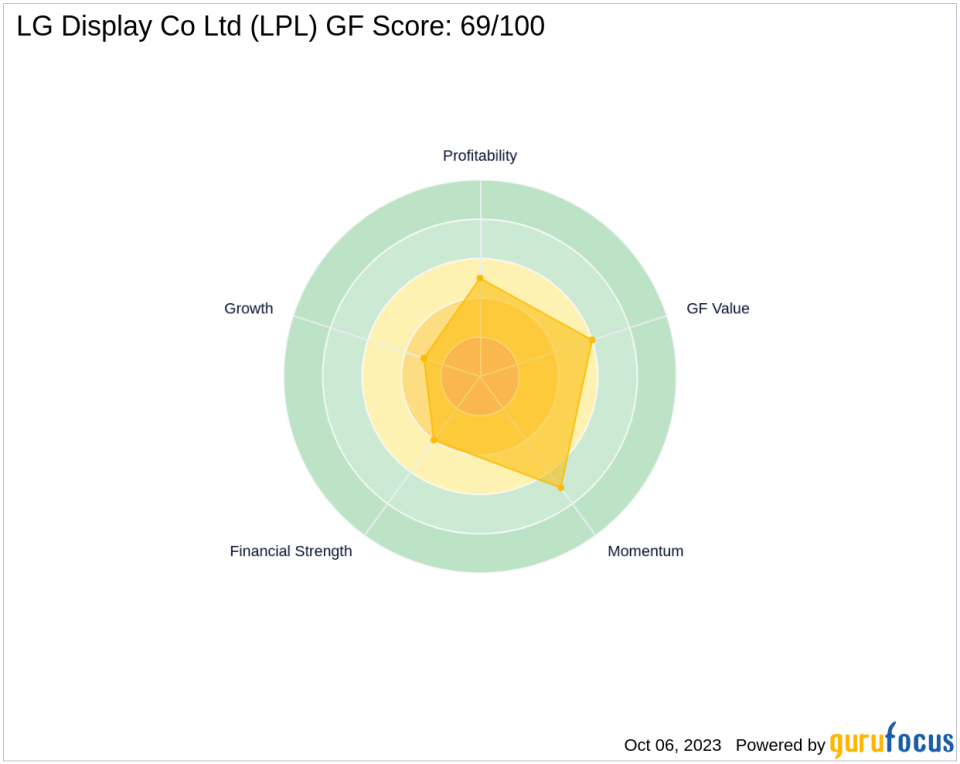
The GF Score is a stock performance ranking system developed by GuruFocus using five aspects of valuation, which has been found to be closely correlated to the long-term performances of stocks by backtesting from 2006 to 2021. The stocks with a higher GF Score generally generate higher returns than those with a lower GF Score. Therefore, when picking stocks, investors should invest in companies with high GF Scores. The GF Score ranges from 0 to 100, with 100 as the highest rank.
Financial strength rank: 4/10
Profitability rank: 5/10
Growth rank: 3/10
GF Value rank: 6/10
Momentum rank: 7/10
Based on the above method, GuruFocus assigned LG Display Co Ltd the GF Score of 69 out of 100, which signals poor future outperformance potential.
LG Display Co Ltd: A Snapshot of the Business
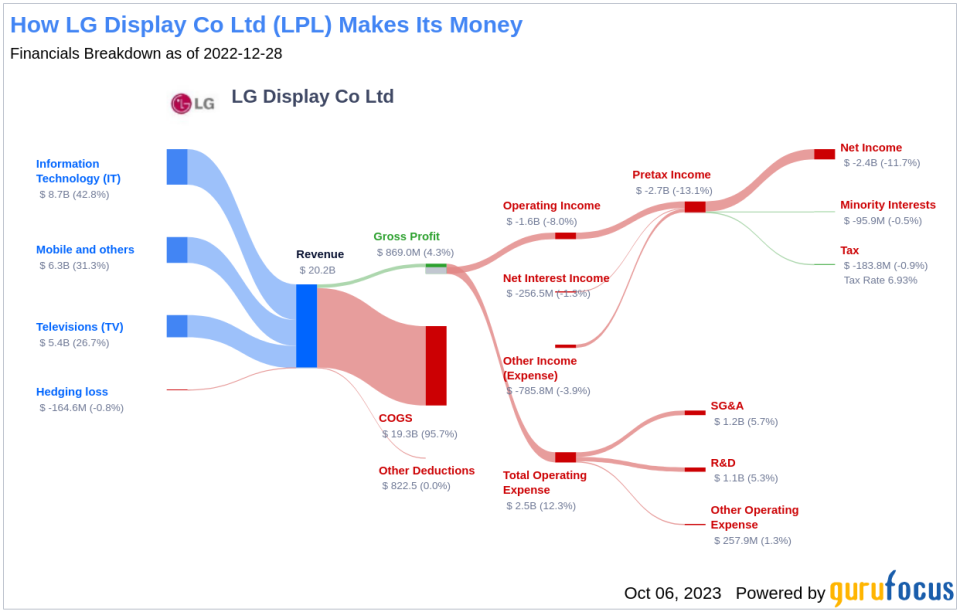
LG Display is a South Korea-based company that is principally engaged in developing, manufacturing and selling TFT-LCD and OLED display panels. The company's products consist of panels for notebook computers, monitors, televisions, smartphones, tablets, and others. The company conducts direct sales through overseas subsidiaries in a number of countries, including the United States, Germany, Japan, Taiwan, China, and Singapore. These subsidiaries conduct sales activities and offer technical support to clients. The company generates the majority of its revenue from overseas markets, with the rest from South Korea.
Financial Strength Breakdown
LG Display Co Ltd's financial strength indicators present some concerning insights about the company's balance sheet health. LG Display Co Ltd has an interest coverage ratio of 0, which positions it worse than 0% of 1608 companies in the Hardware industry. This ratio highlights potential challenges the company might face when handling its interest expenses on outstanding debt. It's worth noting that the esteemed investor Benjamin Graham typically favored companies with an interest coverage ratio of at least five.
The company's Altman Z-Scoreis just 0.34, which is below the distress zone of 1.81. This suggests that the company may face financial distress over the next few years. Additionally, the company's low cash-to-debt ratio at 0.14 indicates a struggle in handling existing debt levels. The company's debt-to-equity ratio is 2.22, which is worse than 95.84% of 2093 companies in the Hardware industry. A high debt-to-equity ratio suggests over-reliance on borrowing and vulnerability to market fluctuations.
Profitability Breakdown
LG Display Co Ltd's low Profitability rank can also raise warning signals. LG Display Co Ltd's Operating Margin has declined over the past five years ((-2,213.71%)), as shown by the following data: 2018: 0.38; 2019: -5.79; 2020: -0.15; 2021: 7.47; 2022: -7.97; . Additionally, LG Display Co Ltd's Gross Margin has also declined over the past five years, as evidenced by the data: 2018: 12.68; 2019: 7.96; 2020: 10.86; 2021: 17.76; 2022: 4.30; . This trend underscores the company's struggles to convert its revenue into profits.
Growth Prospects
A lack of significant growth is another area where LG Display Co Ltd seems to falter, as evidenced by the company's low Growth rank. Lastly, LG Display Co Ltd predictability rank is just one star out of five, adding to investor uncertainty regarding revenue and earnings consistency.

Conclusion
Given the company's financial strength, profitability, and growth metrics, the GF Score highlights the firm's unparalleled position for potential underperformance. While LG Display Co Ltd has a rich history in the Hardware industry, its current financial indicators suggest a challenging road ahead. Investors should consider these factors when making investment decisions.
GuruFocus Premium members can find more companies with strong GF Scores using the following screener link: GF Score Screen
This article, generated by GuruFocus, is designed to provide general insights and is not tailored financial advice. Our commentary is rooted in historical data and analyst projections, utilizing an impartial methodology, and is not intended to serve as specific investment guidance. It does not formulate a recommendation to purchase or divest any stock and does not consider individual investment objectives or financial circumstances. Our objective is to deliver long-term, fundamental data-driven analysis. Be aware that our analysis might not incorporate the most recent, price-sensitive company announcements or qualitative information. GuruFocus holds no position in the stocks mentioned herein.
This article first appeared on GuruFocus.
