Lincoln National (LNC) Q2 Earnings Beat on Lower Expenses
Lincoln National Corporation LNC reported second-quarter 2023 adjusted earnings of $2.02 per share, which outpaced the Zacks Consensus Estimate by 5.2%. However, the bottom line slipped 5.2% year over year.
Adjusted operating revenues grew 5.7% year over year to $4,730 million. The top line beat the consensus mark by 2.8%.
The better-than-expected quarterly results were supported by a significant decline in expense level and solid contribution from the Group Protection segment. However, the upside was partly offset by weaker performances in Annuities, Retirement Plan Services and Life Insurance businesses.
Lincoln National Corporation Price, Consensus and EPS Surprise
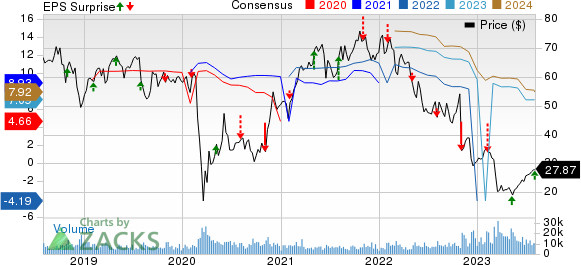
Lincoln National Corporation price-consensus-eps-surprise-chart | Lincoln National Corporation Quote
Costs and Expenses
Total expenses plunged 48.8% year over year to $2,327 million in the quarter under review and remained below our estimate of $3,103.4 million, due to the incidence of a significant MRB gain. Benefits of $2,192 million accounted for 94.2% of the quarter’s overall costs and were above our estimate. Commissions and other expenses rose 10.6% year over year to $1,335 million and were above our model estimate.
Inside LNC’s Segments
The Annuities segment recorded an operating income of $271 million, which decreased 8% year over year and missed the estimate by 6.3%. The metric suffered from reduced prepayment income and increased expenses. Operating revenues of $1,190 million increased 8.5% year over year and comfortably beat our estimate of $973.3 million. Total annuity deposits fell 5.2% year over year to $2,560 million in the quarter under review due to lower variable annuities sales, partially offset by growth in fixed annuities.
Operating income in the Retirement Plan Services segment came in at $47 million, which plunged 14.5% year over year and missed our estimate of $54.1 million due to a decline in prepayment income and an elevated expense level. Operating revenues of $334 million grew 6% year over year in the second quarter and outpaced our estimate of $308 million. Total deposits tumbled 9.5% year over year to $2,897 million.
The Life Insurance segment reported an operating income of $33 million in the quarter under review, falling 47.6% year over year, due to run-rate impact stemming from year-ago annual review of DAC and increased expenses. Operating revenues of $1,760 million inched up 3.2% year over year and comfortably beat our estimate. Total Life Insurance sales dropped 36% year over year to $123 million. Total deposits of $1,333 million fell 8.6% year over year in the second quarter.
The Group Protection segment recorded an operating income of $109 million in the quarter under review, which rose 122.4% year over year and beat our estimate of $80 million. This significant jump can be attributed to better disability and life underwriting results. Operating revenues increased 5.8% year over year to $1,400 million, higher than our estimate of $1,320.9 million. Insurance premiums of $1,263 million rose 6.4% year over year. Sales amounted to $96 million in the segment, which decreased 24% year over year.
Other Operations incurred an operating loss of $106 million in the second quarter, wider than the prior quarter’s loss of $87 million and our estimate of $98.2 million.
Financial Update (as of Jun 30, 2023)
Lincoln National exited the second quarter with cash and invested cash of $3,768 million, which rose from $3,343 million at 2022-end. Total assets of $348.6 billion increased from $334.2 billion at 2022-end.
Long-term debt amounted to $5,954 million, which declined 8.4% year over year. Short-term debt totaled $500 million at the second-quarter end.
Shareholders’ equity of $5,819 million increased from $5,102 million at 2022-end.
Book value per share, excluding accumulated other comprehensive income, came in at $58.58, which fell 14.1% year over year. Adjusted income from operations ROE came in at 12.4%, which improved 160 basis points year over year.
Capital Deployment Update
Lincoln National returned $76 million in the form of common dividends to its shareholders in the second quarter. It did not make any share repurchases in the quarter under review.
Zacks Rank & Key Picks
Lincoln National currently has a Zacks Rank #3 (Hold). Investors interested in the broader finance space can consider better-ranked companies like Ryan Specialty Holdings, Inc. RYAN, Marsh & McLennan Companies, Inc. MMC and Employers Holdings, Inc. EIG, each carrying a Zacks Rank #2 (Buy) at present. You can see the complete list of today’s Zacks #1 Rank (Strong Buy) stocks here.
Headquartered in Chicago, Ryan Specialty offers specialty products and solutions for different types of clients in the insurance industry. The Zacks Consensus Estimate for RYAN’s current year earnings indicates a 16.5% year-over-year increase. It beat earnings estimates in two of the past four quarters, met once and missed on the other occasion, with an average surprise of 2.7%.
New York-based Marsh & McLennan is a globally leading insurance broker. The Zacks Consensus Estimate for MMC’s current-year earnings implies 13.7% year-over-year growth. MMC beat earnings estimates in all the last four quarters, with an average of 3.4%.
Based in Reno, NV, Employers Holdings has vast operations in the commercial property and casualty insurance industry. The Zacks Consensus Estimate for EIG’s current-year bottom line is pegged at $3.23 per share, indicating a 10.2% jump from a year ago.
Want the latest recommendations from Zacks Investment Research? Today, you can download 7 Best Stocks for the Next 30 Days. Click to get this free report
Lincoln National Corporation (LNC) : Free Stock Analysis Report
Marsh & McLennan Companies, Inc. (MMC) : Free Stock Analysis Report
Employers Holdings Inc (EIG) : Free Stock Analysis Report
Ryan Specialty Holdings Inc. (RYAN) : Free Stock Analysis Report
