Lining Up Doves
“After each storm, we become stronger, more solid, and soon we’re no longer fearful of storms. We no longer pray for a calm sky and a calm ocean. Instead, we pray that we have the wisdom and strength to deal with the difficulties that arise in life."
Thich Nhat Hanh Happiness
The View From 30,000 Feet
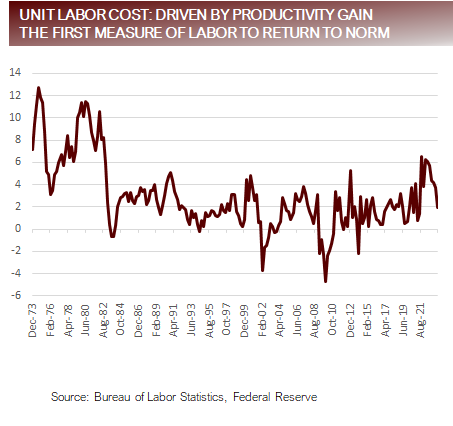
The doves lined up last week guiding the S&P500 up 5.85%, marking the best week of performance for the year. A busy week of data began with the quarterly refunding announcement from the Treasury. After being shell shocked by the magnitude of the July announcement, nervous investors instead had a chance to take a deep breath when the announcement came in slightly lighter than market expectations. The good news continued with positive surprises on Productivity and Unit Labor Costs, a new and improved Powell, who was beaming with confidence, weaving a story of falling inflation matched with cooling employment, and subtly backing away from intentions to hike further.
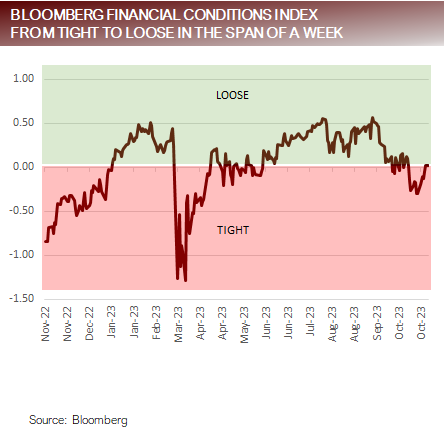
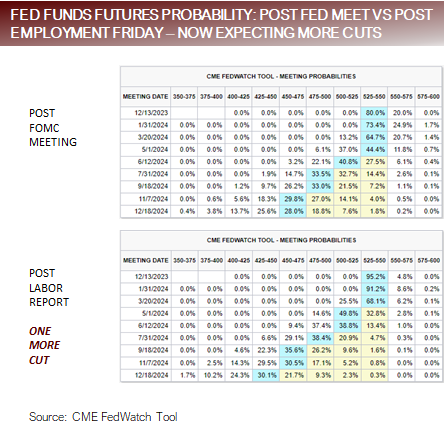
Towards the end of the week claims data reenforced a picture of a more difficult labor market, which was followed by a payroll reports that was in two words – not good. For the markets bad news was good news, and by the end of the week equities were higher, Fed Funds Futures had moved from pricing in three cuts next year to four, Treasury yields began to plumet and financial conditions had loosened significantly with equities continuing to do what they’ve done since July – follow the Treasury market around like a starstruck lover. Not even lackluster comments from Apple were enough to dissuade buyers. Now the big question is – will the rally stick and gel into the consensus Q4 boom expected, or will it fade as bad news actually becomes bad news?
Powell transitions from careful to confident, with the first subtle hints of taking a victory lap Employment data begins to show signs of deterioration, now the worry become non-linearity The first hints of Q4 earnings and data indicate expectations for growth should be tempered The most Frequently Asked Question from clients this week: Is the market rally sustainable?
Powell transitions from careful to confident, hints of taking a victory lap
The language from FOMC statement had nuanced signs of acknowledging improving The assessment of the economy was described as “strong” instead of “solid” and employment was described as “moderated” instead of “slowed”. Powell had a sense of confidence that, in my opinion, we haven’t seen him display The he seemed confident that the Fed had raised rates to restrictive level, but left open that they weren’t sure they are currently restrictive enough. Sounded like a victory lap to me. Paul Krugman, the Nobel winning economist, declared the war against inflation has been won. He hammered home the point that the Committee is not thinking or talking about cutting rates, they are focused on two questions: Are they high enough (restrictive enough) to bring down inflation to their target? How long will they have to keep rates high to gain confidence that inflation is on a trajectory to their target? There were a lot of questions about if tightening financial conditions are doing some of the work for the His response was to acknowledge that the Fed is currently getting help from tighter financial conditions but for it to be helpful the tightening of financial conditions would need to be persistent. The markets took Powell’s responses as proof positive that the Fed is done for the cycle, setting off a rally that soft jobs data poured fire on later in the The irony is that the falling rates, and rising equity market, both feed into loosening of financial conditions, which goes contra to what the Fed needs to see to stay dovish.
Financial conditions not persistent, loan growth moving higher

Employment data shows signs of deterioration
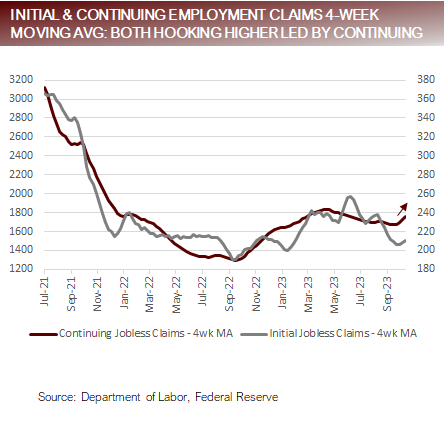
Job openings were The current monthly report beat slightly, while the past month was revised lower by a similar magnitude. Stronger trends in demand were observed in Construction, Manufacturing and Leisure / Hospitality, while weaker trends in demand were observed in Information Tech and Government. With only 31% of those sent surveys bothering to respond, trends are important, but the actual numbers may not reflect reality. ISM survey employment was eventful. Both Manufacturing and Services posted surprising large hits versus expectations to the employment component of the survey. Jobless claims data was Continuing Claims have begun to move up sharply, which may signal employers are not yet cutting employees, but hiring has slowed, so those who are unemployed are having a more difficult time finding work. The Payroll Report was packed full of events. With the recent uptick in claims data and unemployment approaching the Sahm rule, key will be seeing if the Fed can gently land employment which has a habit of non-linear patterns. Nonfarm Payrolls (establishment survey) missed to the downside by a wide margin, printing 150k vs. 180k expected, with the previous period revised lower. However, by definition the establishment survey includes only people who receive pay for the reference period, so the UAW strike added a lot of noise to this number. The Unemployment Rate (household survey) missed to the downside with the Unemployment Rate rising to 3.9% from 3.8%. This is significant because it puts the Unemployment Rate with striking distance to the Sahm Rule, which is the reference point where the three- month moving average of the Unemployment Rate is within half a percent of its 12-month low, and historically has coincided with the beginning of a recession. It should be noted, even Claudia Sahm, who invented the indicator is skeptical that the rule will be accurate this time around.
Claims data hooking higher and labor cost returns to pre-pandemic levels
Q4 earnings, data indicate expectations for growth should be tempered
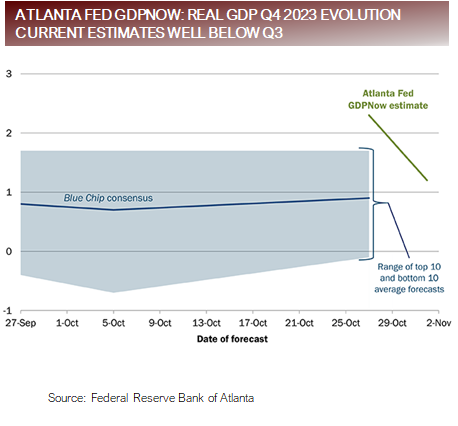
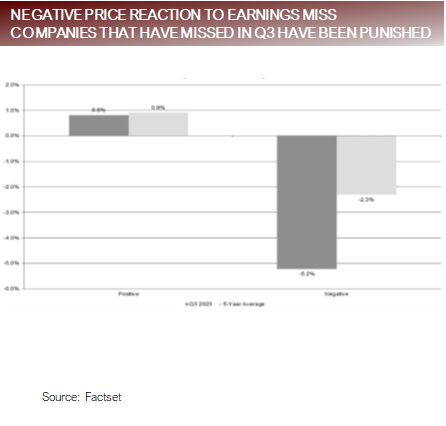
At the end of October the Atlanta Fed GDPNow was the talk of the down because it was indicating near 5% GDP growth for Q3. The same model has now given the first two weekly reading for Q4, where it began projecting 3% and has now fallen to 1.2%. Two other Federal Reserve banks produce GDP Federal Reserve of New York GDP Nowcast: 41% Federal Reserve of Louis GDP Nowcast: 2.31% At this point in the quarter the error bands are wide because now cast models are only projecting based on data reported in the With two months left to go, there are a lot more data. However, one thing seems likely so far, the pace of growth seen in Q3 is unlikely to repeat. With 81% of S&P500 companies having reported, we’re starting to get a read on Two observations come to mind in looking at the data, companies are lowering guidance in Q4, and companies that miss guidance are being severely punished.
The Good News
82% of companies in the S&P500 have reported earnings above their estimates, which is above both the 5 and 10-year The average earnings beat has been 1%, which is below the 5-year average of 8.5%, but above the 10-year average of 6.6%
The Bad News
Analysts have lowered Q4 earning estimates by 9%, which is over twice what’s normally been seen over periods of 5, 10, and 20 years. The average move to the downside of companies missing estimates (looking two days before to two days after earrings release) has been -5.2%, which is over twice the downside over the last 5-years.
Momentum in GDP slowing coming into Q4 and markets are nervous
FAQ: Is the market rally sustainable?
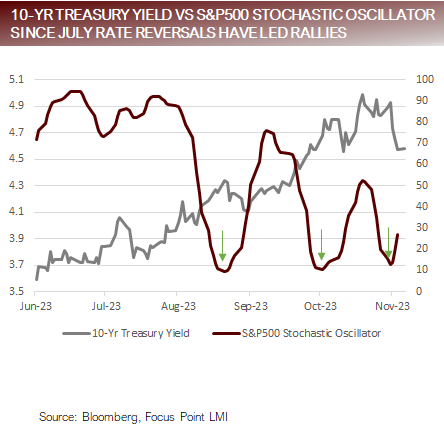
The equity markets have been following the lead of interest rates since July – as interest have rates moved higher, equities have been pressured. Over the last week, quarterly refunding, comments from the Fed, and weak labor numbers have combined to create a situation where the markets are again beginning to price in an increasing number of rate cuts in We have to ask the question, what would cause interest rates to come down faster? The answer is tied to economic weakness, either showing up in GDP, labor or both. The next question would be what does this mean for earnings, and consequently the equity markets? If you’re inclined to believe that equity prices reflect earnings this could be Currently, according to Factset S&P500 2024 Earnings are projected to be $246.39, which represents 11.4% earnings growth over 2023. This would be above the long-term average of 6% to 8% a year. This means that S&P500 is projected to grow at roughly twice the average pace next year while rates are the most restrictive they’ve been since 2007. This seems like a stretch. The equity markets were oversold, and the 10-year failed to on multiple attempts at breaching 0%. We’re fresh off a week were pretty much everything went right to limit further upside in yields, and it showed up in market action. This led to a relief rally in equities, tied to short covering, optimism that the Fed is done and people chasing a yearend Santa Claus rally. It’s hard to tell how much follow through will be behind this, but it doesn’t seem to be a fundamental move if what we’re seeing companies and analysts lowering earnings expectations, GDP forecasts falling and labor cooling off. Bottom line, it’s too early to tell if the rally will have legs and if it does to what level, but if it does continue, the bigger question is will this be the last nickel to be picked up before the steam roller moves in for the kill?
Last week’s market rally driven by rates move lower
Putting it all together
The fall in equity prices in Q3 was driven by the steady rise in With Powell signaling the hiking cycle may be done, and the first readings on Q4 GDP and employment data coming in generally weaker than expected, it appears that the ceiling on rates may be in unless growth data employment, start to signal more resilience. The equity market’s manic reactions to yields and each print of economic data highlights the data dependency stage the Fed has set, where each economic release generates euphoric reactions of joy or fits of terror and despondence. This leaves some questions for the equity markets. If the late summer/fall selloff was driven by rising rates, is it reasonable to expect a ceiling in rates will create (i) a sizeable rally, (ii) a consolidation or (iii) a continuation of the downtrend? If the ceiling in rates is a result of poor economic data, it may well lead to weaker It’s hard to make a case for significantly higher prices in equities with poor data and falling earnings. It’s also hard to make a case for a resumption of the downtrend until information substantiates that the bad news is so bad that it’s actually bad news for earnings, which hasn’t happened yet. This means that market are likely caught in a trading Now that the data appears to have begun deteriorating, we’ll need to see the glide path of the deterioration to determine if the markets can deliver on 2024 earnings expectations in spite of not so bad economic news, which could signal upside, or will the economy be overcome by the traditional negative feedback loops that are typically observed with material slowdowns.
For more news, information, and analysis, visit VettaFi | ETFDB.
Performance data quoted represents past performance, which is not a guarantee of future results. No representation is made that a client will, or is likely to, achieve positive returns, avoid losses, or experience returns similar to those shown or experienced in the past.
Focus Point LMI LLC
For more information, please visit www.focuspointlmi.com or contact us at info@focuspointlmi.com Copyright 2023, Focus Point LMI LLC. All rights reserved.
The text, images and other materials contained or displayed on any Focus Point LMI LLC Inc. product, service, report, e-mail or web site are proprietary to Focus Point LMI LLC Inc. and constitute valuable intellectual property and copyright. No material from any part of any Focus Point LMI LLC Inc. website may be downloaded, transmitted, broadcast, transferred, assigned, reproduced or in any other way used or otherwise disseminated in any form to any person or entity, without the explicit written consent of Focus Point LMI LLC Inc. All unauthorized reproduction or other use of material from Focus Point LMI LLC Inc. shall be deemed willful infringement(s) of Focus Point LMI LLC Inc. copyright and other proprietary and intellectual property rights, including but not limited to, rights of privacy. Focus Point LMI LLC Inc. expressly reserves all rights in connection with its intellectual property, including without limitation the right to block the transfer of its products and services and/or to track usage thereof, through electronic tracking technology, and all other lawful means, now known or hereafter devised. Focus Point LMI LLC Inc. reserves the right, without further notice, to pursue to the fullest extent allowed by the law any and all criminal and civil remedies for the violation of its rights.
All unauthorized use of material shall be deemed willful infringement of Focus Point LMI LLC Inc. copyright and other proprietary and intellectual property rights. While Focus Point LMI LLC will use its reasonable best efforts to provide accurate and informative Information Services to Subscriber, Focus Point LMI LLC but cannot guarantee the accuracy, relevance and/or completeness of the Information Services, or other information used in connection therewith. Focus Point LMI LLC, its affiliates, shareholders, directors, officers, and employees shall have no liability, contingent or otherwise, for any claims or damages arising in connection with (i) the use by Subscriber of the Information Services and/or (ii) any errors, omissions or inaccuracies in the Information Services. The Information Services are provided for the benefit of the Subscriber. It is not to be used or otherwise relied on by any other person. Some of the data contained in this publication may have been obtained from The Federal Reserve, Bloomberg Barclays Indices; Bloomberg Finance L.P.; CBRE Inc.; IHS Markit; MSCI Inc. Neither MSCI Inc. nor any other party involved in or related to compiling, computing or creating the MSCI Inc. data makes any express or implied warranties or representations with respect to such data (or the results to be obtained by the use thereof), and all such parties hereby expressly disclaim all warranties of originality, accuracy, completeness, merchantability or fitness for a particular purpose with respect to any of such data. Such party, its affiliates and suppliers (“Content Providers”) do not guarantee the accuracy, adequacy, completeness, timeliness or availability of any Content and are not responsible for any errors or omissions (negligent or otherwise), regardless of the cause, or for the results obtained from the use of such Content. In no event shall Content Providers be liable for any damages, costs, expenses, legal fees, or losses (including lost income or lost profit and opportunity costs) in connection with any use of the Content. A reference to a particular investment or security, a rating or any observation concerning an investment that is part of the Content is not a recommendation to buy, sell or hold such investment or security, does not address the suitability of an investment or security and should not be relied on as investment advice.
This communication reflects our analysts’ current opinions and may be updated as views or information change. Past results do not guarantee future performance. Business and market conditions, laws, regulations, and other factors affecting performance all change over time, which could change the status of the information in this publication. Using any graph, chart, formula, model, or other device to assist in making investment decisions presents many difficulties and their effectiveness has significant limitations, including that prior patterns may not repeat themselves and market participants using such devices can impact the market in a way that changes their effectiveness. Focus Point LMI LLC believes no individual graph, chart, formula, model, or other device should be used as the sole basis for any investment decision. Focus Point LMI LLC or its affiliated companies or their respective shareholders, directors, officers and/or employees, may have long or short positions in the securities discussed herein and may purchase or sell such securities without notice. Neither Focus Point LMI LLC nor the author is rendering investment, tax, or legal advice, nor offering individualized advice tailored to any specific portfolio or to any individual’s particular suitability or needs. Investors should seek professional investment, tax, legal, and accounting advice prior to making investment decisions. Focus Point LMI LLC’s publications do not constitute an offer to sell any security, nor a solicitation of an offer to buy any security. They are designed to provide information, data and analysis believed to be accurate, but they are not guaranteed and are provided “as is” without warranty of any kind, either express or implied.
FOCUS POINT LMI LLC DISCLAIMS ANY AND ALL EXPRESS OR IMPLIED WARRANTIES, INCLUDING, BUT NOT LIMITED TO, ANY WARRANTIES OF MERCHANTABILITY, SUITABILITY OR FITNESS FOR A PARTICULAR PURPOSE OR USE.
Focus Point LMI LLC, its affiliates, officers, or employees, and any third-party data provider shall not have any liability for any loss sustained by anyone who has relied on the information contained in any Focus Point LMI LLC publication, and they shall not be liable to any party for any direct, indirect, incidental, exemplary, compensatory, punitive, special or consequential damages, costs, expenses, legal fees, or losses (including, without limitation, lost income or lost profits and opportunity costs) in connection with any use of the information or opinions contained Focus Point LMI LLC publications even if advised of the possibility of such damages.
