A Look At The Fair Value Of Ark Restaurants Corp. (NASDAQ:ARKR)
Key Insights
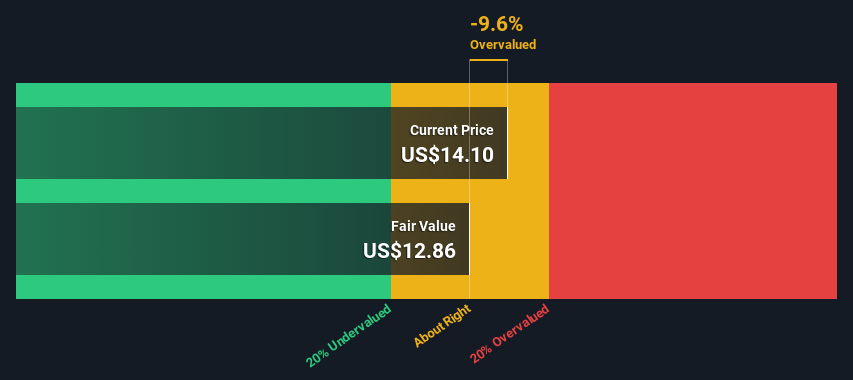
The projected fair value for Ark Restaurants is US$12.86 based on 2 Stage Free Cash Flow to Equity
With US$14.10 share price, Ark Restaurants appears to be trading close to its estimated fair value
Industry average of 5.9% suggests Ark Restaurants' peers are currently trading at a lower premium to fair value
Today we will run through one way of estimating the intrinsic value of Ark Restaurants Corp. (NASDAQ:ARKR) by taking the forecast future cash flows of the company and discounting them back to today's value. This will be done using the Discounted Cash Flow (DCF) model. Models like these may appear beyond the comprehension of a lay person, but they're fairly easy to follow.
Remember though, that there are many ways to estimate a company's value, and a DCF is just one method. If you still have some burning questions about this type of valuation, take a look at the Simply Wall St analysis model.
See our latest analysis for Ark Restaurants
Step By Step Through The Calculation
We're using the 2-stage growth model, which simply means we take in account two stages of company's growth. In the initial period the company may have a higher growth rate and the second stage is usually assumed to have a stable growth rate. To begin with, we have to get estimates of the next ten years of cash flows. Seeing as no analyst estimates of free cash flow are available to us, we have extrapolate the previous free cash flow (FCF) from the company's last reported value. We assume companies with shrinking free cash flow will slow their rate of shrinkage, and that companies with growing free cash flow will see their growth rate slow, over this period. We do this to reflect that growth tends to slow more in the early years than it does in later years.
A DCF is all about the idea that a dollar in the future is less valuable than a dollar today, and so the sum of these future cash flows is then discounted to today's value:
10-year free cash flow (FCF) forecast
2024 | 2025 | 2026 | 2027 | 2028 | 2029 | 2030 | 2031 | 2032 | 2033 | |
Levered FCF ($, Millions) | US$4.89m | US$4.73m | US$4.66m | US$4.64m | US$4.66m | US$4.70m | US$4.77m | US$4.84m | US$4.93m | US$5.03m |
Growth Rate Estimate Source | Est @ -5.55% | Est @ -3.20% | Est @ -1.55% | Est @ -0.40% | Est @ 0.41% | Est @ 0.97% | Est @ 1.37% | Est @ 1.64% | Est @ 1.84% | Est @ 1.97% |
Present Value ($, Millions) Discounted @ 11% | US$4.4 | US$3.8 | US$3.4 | US$3.0 | US$2.7 | US$2.4 | US$2.2 | US$2.0 | US$1.9 | US$1.7 |
("Est" = FCF growth rate estimated by Simply Wall St)
Present Value of 10-year Cash Flow (PVCF) = US$28m
The second stage is also known as Terminal Value, this is the business's cash flow after the first stage. For a number of reasons a very conservative growth rate is used that cannot exceed that of a country's GDP growth. In this case we have used the 5-year average of the 10-year government bond yield (2.3%) to estimate future growth. In the same way as with the 10-year 'growth' period, we discount future cash flows to today's value, using a cost of equity of 11%.
Terminal Value (TV)= FCF2033 × (1 + g) ÷ (r – g) = US$5.0m× (1 + 2.3%) ÷ (11%– 2.3%) = US$56m
Present Value of Terminal Value (PVTV)= TV / (1 + r)10= US$56m÷ ( 1 + 11%)10= US$19m
The total value is the sum of cash flows for the next ten years plus the discounted terminal value, which results in the Total Equity Value, which in this case is US$46m. To get the intrinsic value per share, we divide this by the total number of shares outstanding. Compared to the current share price of US$14.1, the company appears around fair value at the time of writing. The assumptions in any calculation have a big impact on the valuation, so it is better to view this as a rough estimate, not precise down to the last cent.
Important Assumptions
We would point out that the most important inputs to a discounted cash flow are the discount rate and of course the actual cash flows. You don't have to agree with these inputs, I recommend redoing the calculations yourself and playing with them. The DCF also does not consider the possible cyclicality of an industry, or a company's future capital requirements, so it does not give a full picture of a company's potential performance. Given that we are looking at Ark Restaurants as potential shareholders, the cost of equity is used as the discount rate, rather than the cost of capital (or weighted average cost of capital, WACC) which accounts for debt. In this calculation we've used 11%, which is based on a levered beta of 2.000. Beta is a measure of a stock's volatility, compared to the market as a whole. We get our beta from the industry average beta of globally comparable companies, with an imposed limit between 0.8 and 2.0, which is a reasonable range for a stable business.
SWOT Analysis for Ark Restaurants
Strength
Debt is not viewed as a risk.
Dividend is in the top 25% of dividend payers in the market.
Weakness
Current share price is above our estimate of fair value.
Opportunity
Has sufficient cash runway for more than 3 years based on current free cash flows.
Lack of analyst coverage makes it difficult to determine ARKR's earnings prospects.
Threat
Paying a dividend but company is unprofitable.
Looking Ahead:
Whilst important, the DCF calculation is only one of many factors that you need to assess for a company. DCF models are not the be-all and end-all of investment valuation. Preferably you'd apply different cases and assumptions and see how they would impact the company's valuation. For instance, if the terminal value growth rate is adjusted slightly, it can dramatically alter the overall result. For Ark Restaurants, we've compiled three additional factors you should further research:
Risks: For instance, we've identified 2 warning signs for Ark Restaurants that you should be aware of.
Other High Quality Alternatives: Do you like a good all-rounder? Explore our interactive list of high quality stocks to get an idea of what else is out there you may be missing!
Other Environmentally-Friendly Companies: Concerned about the environment and think consumers will buy eco-friendly products more and more? Browse through our interactive list of companies that are thinking about a greener future to discover some stocks you may not have thought of!
PS. The Simply Wall St app conducts a discounted cash flow valuation for every stock on the NASDAQGM every day. If you want to find the calculation for other stocks just search here.
Have feedback on this article? Concerned about the content? Get in touch with us directly. Alternatively, email editorial-team (at) simplywallst.com.
This article by Simply Wall St is general in nature. We provide commentary based on historical data and analyst forecasts only using an unbiased methodology and our articles are not intended to be financial advice. It does not constitute a recommendation to buy or sell any stock, and does not take account of your objectives, or your financial situation. We aim to bring you long-term focused analysis driven by fundamental data. Note that our analysis may not factor in the latest price-sensitive company announcements or qualitative material. Simply Wall St has no position in any stocks mentioned.
