A Look At The Fair Value Of Ethan Allen Interiors Inc. (NYSE:ETD)
Key Insights
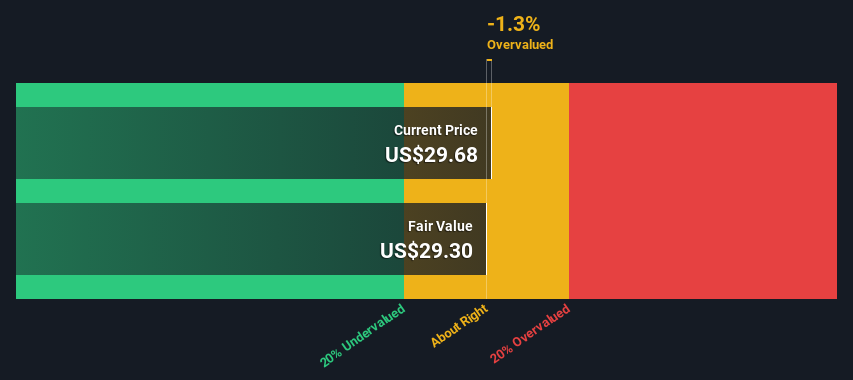
Using the 2 Stage Free Cash Flow to Equity, Ethan Allen Interiors fair value estimate is US$29.30
Current share price of US$29.68 suggests Ethan Allen Interiors is potentially trading close to its fair value
Industry average of 11% suggests Ethan Allen Interiors' peers are currently trading at a higher premium to fair value
Today we'll do a simple run through of a valuation method used to estimate the attractiveness of Ethan Allen Interiors Inc. (NYSE:ETD) as an investment opportunity by projecting its future cash flows and then discounting them to today's value. We will use the Discounted Cash Flow (DCF) model on this occasion. It may sound complicated, but actually it is quite simple!
We generally believe that a company's value is the present value of all of the cash it will generate in the future. However, a DCF is just one valuation metric among many, and it is not without flaws. If you want to learn more about discounted cash flow, the rationale behind this calculation can be read in detail in the Simply Wall St analysis model.
Check out our latest analysis for Ethan Allen Interiors
The Calculation
We use what is known as a 2-stage model, which simply means we have two different periods of growth rates for the company's cash flows. Generally the first stage is higher growth, and the second stage is a lower growth phase. In the first stage we need to estimate the cash flows to the business over the next ten years. Seeing as no analyst estimates of free cash flow are available to us, we have extrapolate the previous free cash flow (FCF) from the company's last reported value. We assume companies with shrinking free cash flow will slow their rate of shrinkage, and that companies with growing free cash flow will see their growth rate slow, over this period. We do this to reflect that growth tends to slow more in the early years than it does in later years.
A DCF is all about the idea that a dollar in the future is less valuable than a dollar today, so we discount the value of these future cash flows to their estimated value in today's dollars:
10-year free cash flow (FCF) forecast
2024 | 2025 | 2026 | 2027 | 2028 | 2029 | 2030 | 2031 | 2032 | 2033 | |
Levered FCF ($, Millions) | US$60.4m | US$57.3m | US$55.6m | US$54.8m | US$54.6m | US$54.9m | US$55.4m | US$56.1m | US$57.0m | US$58.1m |
Growth Rate Estimate Source | Est @ -8.36% | Est @ -5.19% | Est @ -2.96% | Est @ -1.41% | Est @ -0.32% | Est @ 0.44% | Est @ 0.98% | Est @ 1.35% | Est @ 1.61% | Est @ 1.79% |
Present Value ($, Millions) Discounted @ 8.9% | US$55.5 | US$48.3 | US$43.0 | US$39.0 | US$35.7 | US$32.9 | US$30.5 | US$28.4 | US$26.5 | US$24.8 |
("Est" = FCF growth rate estimated by Simply Wall St)
Present Value of 10-year Cash Flow (PVCF) = US$365m
We now need to calculate the Terminal Value, which accounts for all the future cash flows after this ten year period. The Gordon Growth formula is used to calculate Terminal Value at a future annual growth rate equal to the 5-year average of the 10-year government bond yield of 2.2%. We discount the terminal cash flows to today's value at a cost of equity of 8.9%.
Terminal Value (TV)= FCF2033 × (1 + g) ÷ (r – g) = US$58m× (1 + 2.2%) ÷ (8.9%– 2.2%) = US$890m
Present Value of Terminal Value (PVTV)= TV / (1 + r)10= US$890m÷ ( 1 + 8.9%)10= US$379m
The total value, or equity value, is then the sum of the present value of the future cash flows, which in this case is US$744m. In the final step we divide the equity value by the number of shares outstanding. Compared to the current share price of US$29.7, the company appears around fair value at the time of writing. The assumptions in any calculation have a big impact on the valuation, so it is better to view this as a rough estimate, not precise down to the last cent.
The Assumptions
We would point out that the most important inputs to a discounted cash flow are the discount rate and of course the actual cash flows. If you don't agree with these result, have a go at the calculation yourself and play with the assumptions. The DCF also does not consider the possible cyclicality of an industry, or a company's future capital requirements, so it does not give a full picture of a company's potential performance. Given that we are looking at Ethan Allen Interiors as potential shareholders, the cost of equity is used as the discount rate, rather than the cost of capital (or weighted average cost of capital, WACC) which accounts for debt. In this calculation we've used 8.9%, which is based on a levered beta of 1.335. Beta is a measure of a stock's volatility, compared to the market as a whole. We get our beta from the industry average beta of globally comparable companies, with an imposed limit between 0.8 and 2.0, which is a reasonable range for a stable business.
SWOT Analysis for Ethan Allen Interiors
Strength
Currently debt free.
Dividends are covered by earnings and cash flows.
Dividend is in the top 25% of dividend payers in the market.
Weakness
Earnings declined over the past year.
Opportunity
Good value based on P/E ratio compared to estimated Fair P/E ratio.
Threat
No apparent threats visible for ETD.
Moving On:
Whilst important, the DCF calculation ideally won't be the sole piece of analysis you scrutinize for a company. The DCF model is not a perfect stock valuation tool. Instead the best use for a DCF model is to test certain assumptions and theories to see if they would lead to the company being undervalued or overvalued. If a company grows at a different rate, or if its cost of equity or risk free rate changes sharply, the output can look very different. For Ethan Allen Interiors, there are three important factors you should look at:
Risks: As an example, we've found 2 warning signs for Ethan Allen Interiors (1 makes us a bit uncomfortable!) that you need to consider before investing here.
Future Earnings: How does ETD's growth rate compare to its peers and the wider market? Dig deeper into the analyst consensus number for the upcoming years by interacting with our free analyst growth expectation chart.
Other High Quality Alternatives: Do you like a good all-rounder? Explore our interactive list of high quality stocks to get an idea of what else is out there you may be missing!
PS. The Simply Wall St app conducts a discounted cash flow valuation for every stock on the NYSE every day. If you want to find the calculation for other stocks just search here.
Have feedback on this article? Concerned about the content? Get in touch with us directly. Alternatively, email editorial-team (at) simplywallst.com.
This article by Simply Wall St is general in nature. We provide commentary based on historical data and analyst forecasts only using an unbiased methodology and our articles are not intended to be financial advice. It does not constitute a recommendation to buy or sell any stock, and does not take account of your objectives, or your financial situation. We aim to bring you long-term focused analysis driven by fundamental data. Note that our analysis may not factor in the latest price-sensitive company announcements or qualitative material. Simply Wall St has no position in any stocks mentioned.
