A Look At The Intrinsic Value Of The St. Joe Company (NYSE:JOE)
Key Insights
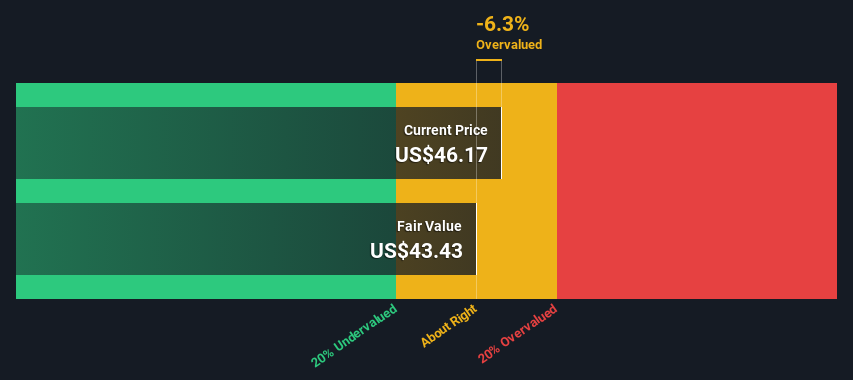
The projected fair value for St. Joe is US$43.43 based on 2 Stage Free Cash Flow to Equity
Current share price of US$46.17 suggests St. Joe is potentially trading close to its fair value
St. Joe's peers seem to be trading at a higher premium to fair value based onthe industry average of -127%
How far off is The St. Joe Company (NYSE:JOE) from its intrinsic value? Using the most recent financial data, we'll take a look at whether the stock is fairly priced by taking the expected future cash flows and discounting them to their present value. One way to achieve this is by employing the Discounted Cash Flow (DCF) model. Don't get put off by the jargon, the math behind it is actually quite straightforward.
We generally believe that a company's value is the present value of all of the cash it will generate in the future. However, a DCF is just one valuation metric among many, and it is not without flaws. For those who are keen learners of equity analysis, the Simply Wall St analysis model here may be something of interest to you.
View our latest analysis for St. Joe
The Calculation
We're using the 2-stage growth model, which simply means we take in account two stages of company's growth. In the initial period the company may have a higher growth rate and the second stage is usually assumed to have a stable growth rate. To start off with, we need to estimate the next ten years of cash flows. Seeing as no analyst estimates of free cash flow are available to us, we have extrapolate the previous free cash flow (FCF) from the company's last reported value. We assume companies with shrinking free cash flow will slow their rate of shrinkage, and that companies with growing free cash flow will see their growth rate slow, over this period. We do this to reflect that growth tends to slow more in the early years than it does in later years.
Generally we assume that a dollar today is more valuable than a dollar in the future, so we need to discount the sum of these future cash flows to arrive at a present value estimate:
10-year free cash flow (FCF) forecast
2024 | 2025 | 2026 | 2027 | 2028 | 2029 | 2030 | 2031 | 2032 | 2033 | |
Levered FCF ($, Millions) | US$115.7m | US$126.4m | US$135.4m | US$143.1m | US$149.6m | US$155.4m | US$160.6m | US$165.4m | US$169.9m | US$174.3m |
Growth Rate Estimate Source | Est @ 12.31% | Est @ 9.26% | Est @ 7.13% | Est @ 5.63% | Est @ 4.59% | Est @ 3.86% | Est @ 3.35% | Est @ 2.99% | Est @ 2.74% | Est @ 2.56% |
Present Value ($, Millions) Discounted @ 7.7% | US$107 | US$109 | US$109 | US$106 | US$103 | US$99.8 | US$95.8 | US$91.6 | US$87.4 | US$83.3 |
("Est" = FCF growth rate estimated by Simply Wall St)
Present Value of 10-year Cash Flow (PVCF) = US$993m
After calculating the present value of future cash flows in the initial 10-year period, we need to calculate the Terminal Value, which accounts for all future cash flows beyond the first stage. For a number of reasons a very conservative growth rate is used that cannot exceed that of a country's GDP growth. In this case we have used the 5-year average of the 10-year government bond yield (2.2%) to estimate future growth. In the same way as with the 10-year 'growth' period, we discount future cash flows to today's value, using a cost of equity of 7.7%.
Terminal Value (TV)= FCF2033 × (1 + g) ÷ (r – g) = US$174m× (1 + 2.2%) ÷ (7.7%– 2.2%) = US$3.2b
Present Value of Terminal Value (PVTV)= TV / (1 + r)10= US$3.2b÷ ( 1 + 7.7%)10= US$1.5b
The total value is the sum of cash flows for the next ten years plus the discounted terminal value, which results in the Total Equity Value, which in this case is US$2.5b. In the final step we divide the equity value by the number of shares outstanding. Compared to the current share price of US$46.2, the company appears around fair value at the time of writing. Remember though, that this is just an approximate valuation, and like any complex formula - garbage in, garbage out.
Important Assumptions
Now the most important inputs to a discounted cash flow are the discount rate, and of course, the actual cash flows. Part of investing is coming up with your own evaluation of a company's future performance, so try the calculation yourself and check your own assumptions. The DCF also does not consider the possible cyclicality of an industry, or a company's future capital requirements, so it does not give a full picture of a company's potential performance. Given that we are looking at St. Joe as potential shareholders, the cost of equity is used as the discount rate, rather than the cost of capital (or weighted average cost of capital, WACC) which accounts for debt. In this calculation we've used 7.7%, which is based on a levered beta of 1.103. Beta is a measure of a stock's volatility, compared to the market as a whole. We get our beta from the industry average beta of globally comparable companies, with an imposed limit between 0.8 and 2.0, which is a reasonable range for a stable business.
SWOT Analysis for St. Joe
Strength
Earnings growth over the past year exceeded the industry.
Debt is well covered by earnings.
Dividends are covered by earnings and cash flows.
Weakness
Dividend is low compared to the top 25% of dividend payers in the Real Estate market.
Current share price is above our estimate of fair value.
Opportunity
JOE's financial characteristics indicate limited near-term opportunities for shareholders.
Lack of analyst coverage makes it difficult to determine JOE's earnings prospects.
Threat
Debt is not well covered by operating cash flow.
Looking Ahead:
Although the valuation of a company is important, it is only one of many factors that you need to assess for a company. The DCF model is not a perfect stock valuation tool. Preferably you'd apply different cases and assumptions and see how they would impact the company's valuation. For instance, if the terminal value growth rate is adjusted slightly, it can dramatically alter the overall result. For St. Joe, we've compiled three pertinent items you should look at:
Risks: We feel that you should assess the 1 warning sign for St. Joe we've flagged before making an investment in the company.
Other High Quality Alternatives: Do you like a good all-rounder? Explore our interactive list of high quality stocks to get an idea of what else is out there you may be missing!
Other Top Analyst Picks: Interested to see what the analysts are thinking? Take a look at our interactive list of analysts' top stock picks to find out what they feel might have an attractive future outlook!
PS. The Simply Wall St app conducts a discounted cash flow valuation for every stock on the NYSE every day. If you want to find the calculation for other stocks just search here.
Have feedback on this article? Concerned about the content? Get in touch with us directly. Alternatively, email editorial-team (at) simplywallst.com.
This article by Simply Wall St is general in nature. We provide commentary based on historical data and analyst forecasts only using an unbiased methodology and our articles are not intended to be financial advice. It does not constitute a recommendation to buy or sell any stock, and does not take account of your objectives, or your financial situation. We aim to bring you long-term focused analysis driven by fundamental data. Note that our analysis may not factor in the latest price-sensitive company announcements or qualitative material. Simply Wall St has no position in any stocks mentioned.
