Looking Under The Hood Of EV ETFs

Electric vehicle adoption appears to be reaching a critical inflection point both in the U.S. and abroad, a trend that could supercharge related ETFs in the coming years.
Domestically, electric vehicle adoption got a boost with the recent passage of the infrastructure bill. The bill included $7.5 billion in spending for low- and zero-emission transportation as well as an equal amount to facilitate the build of a nationwide network of plug-in EV chargers.
Overseas, Norway is set to ban sales of new gas-powered cars in 2025, but adoption is running ahead of schedule. Current estimates show about 80% of cars sold in Norway use EV technology.
With global adoption at differing levels but all seemingly trending in the same direction, it’s worth digging into two ETFs that look set to capitalize on this coming shift.
The iShares Self-Driving EV and Tech ETF (IDRV) and the Global X Autonomous & Electric Vehicles ETF (DRIV) have similar tickers. But comparing the two funds using the ETF Comparison Tool shows that these ETFs have some differences between them.

Courtesy of FactSet
DRIV’s launch in April 2018 has enabled it to gather nearly $1.3 billion in assets, over double the amount of assets held by IDRV, which launched just a year later. However, IDRV’s expense ratio is 0.21% cheaper than that of DRIV and seemingly more diversified, with 101 holdings versus DRIV’s 77.
Slightly Different Philosophies
IDRV offers exposure to a cap-weighted portfolio of companies that produce autonomous driving vehicles, electric vehicles, and batteries or related technologies for these types of vehicles. The portfolio is global in nature, allowing for companies from developed as well as emerging markets and all market cap sizes.
DRIV offers exposure to similar types of companies around the world but uses artificial intelligence to identify companies involved within these industries. The natural language processing algorithm assigns a score to companies based on how frequently each firm is referenced in relation to specific keywords in public documents.
The differing selection methodologies result in differences between the indexes, though there is significant overlap across the portfolios.
Courtesy of FactSet
(For a larger view, click on the image above)
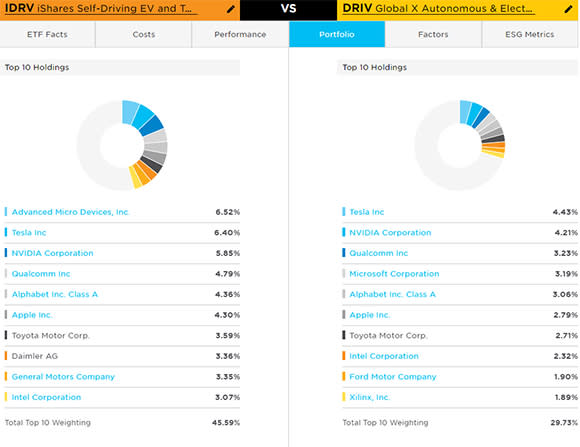
Currently, seven out of the top 10 names are found within both portfolios. However, IDRV has higher weightings to these names due to DRIV’s modified market-cap-weighting methodology that caps companies at a maximum of 3% during each semiannual rebalance.
As a result, IDRV’s portfolio has a significantly higher weighting within its top 10 holdings, making up 45.6% of the portfolio relative to 29.7% for DRIV.
Minimal Effect On Performance
In spite of these slight portfolio construction differences, performance of the two ETFs has been highly correlated with one another.

Since IDRV’s launch in April 2019, both ETFs have seen triple-digit gains. DRIV has had slightly more success, breaking north of IDRV in 2021 and maintaining the performance gap since.
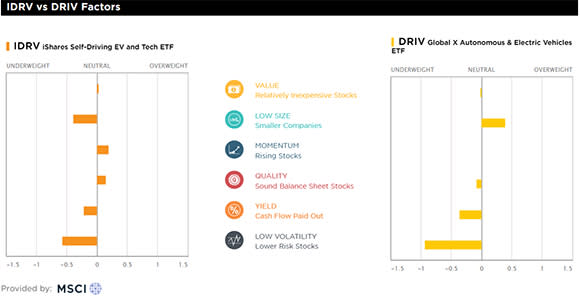
A comparison of the factor tilts within the portfolio hints that DRIV’s tilt toward smaller companies could give it some more horsepower in strong up-markets.
(For a larger view, click on the image above)
Global Phenomenon
As discussed in the beginning of the article, EV adoption is truly a global phenomenon, so it makes sense that both of these ETFs would take a global, all-cap approach to portfolio construction.
Though both ETFs can essentially “go anywhere” in terms of index security selection, IDRV is slightly more diversified on a regional level. Currently, about 56.1% of the portfolio is in U.S.-based companies, with the rest of the portfolio being allocated around the world.
Courtesy of FactSet
(For a larger view, click on the image above)
Compared with IDRV’s allocation, DRIV has a higher domestic focus, a smaller allocation to Germany and South Korea, and a higher allocation to Canada.
Courtesy of FactSet
(For a larger view, click on the image above)
These slight differences in portfolio construction and methodology might make one ETF more appealing over the other, depending on investor preference.
However, because the differences are so small, the portfolios should exhibit a high degree of correlation in performance going forward due to the substantial portfolio overlap and narrow focus.
Contact Jessica Ferringer at jessica.ferringer@etf.com or follow her on Twitter
Recommended Stories


