How Do Lum Chang Holdings Limited’s (SGX:L19) Returns Compare To Its Industry?

Today we’ll look at Lum Chang Holdings Limited (SGX:L19) and reflect on its potential as an investment. In particular, we’ll consider its Return On Capital Employed (ROCE), as that can give us insight into how profitably the company is able to employ capital in its business.
First, we’ll go over how we calculate ROCE. Second, we’ll look at its ROCE compared to similar companies. Last but not least, we’ll look at what impact its current liabilities have on its ROCE.
Understanding Return On Capital Employed (ROCE)
ROCE is a measure of a company’s yearly pre-tax profit (its return), relative to the capital employed in the business. In general, businesses with a higher ROCE are usually better quality. Overall, it is a valuable metric that has its flaws. Author Edwin Whiting says to be careful when comparing the ROCE of different businesses, since ‘No two businesses are exactly alike.’
So, How Do We Calculate ROCE?
Analysts use this formula to calculate return on capital employed:
Return on Capital Employed = Earnings Before Interest and Tax (EBIT) ÷ (Total Assets – Current Liabilities)
Or for Lum Chang Holdings:
0.041 = S$22m ÷ (S$608m – S$134m) (Based on the trailing twelve months to September 2018.)
So, Lum Chang Holdings has an ROCE of 4.1%.
View our latest analysis for Lum Chang Holdings
Want to help shape the future of investing tools and platforms? Take the survey and be part of one of the most advanced studies of stock market investors to date.
Is Lum Chang Holdings’s ROCE Good?
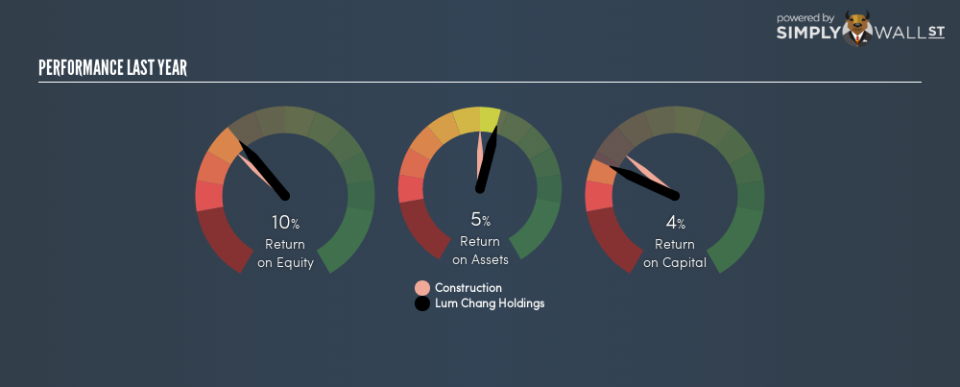
ROCE is commonly used for comparing the performance of similar businesses. Using our data, Lum Chang Holdings’s ROCE appears to be significantly below the 6.9% average in the Construction industry. This performance could be negative if sustained, as it suggests the business may underperform its industry. Putting aside Lum Chang Holdings’s performance relative to its industry, its ROCE in absolute terms is poor – considering the risk of owning stocks compared to government bonds. It is likely that there are more attractive prospects out there.
Lum Chang Holdings’s current ROCE of 4.1% is lower than 3 years ago, when the company reported a 5.9% ROCE. This makes us wonder if the business is facing new challenges.
It is important to remember that ROCE shows past performance, and is not necessarily predictive. ROCE can be misleading for companies in cyclical industries, with returns looking impressive during the boom times, but very weak during the busts. This is because ROCE only looks at one year, instead of considering returns across a whole cycle. You can check if Lum Chang Holdings has cyclical profits by looking at this free graph of past earnings, revenue and cash flow.
How Lum Chang Holdings’s Current Liabilities Impact Its ROCE
Current liabilities include invoices, such as supplier payments, short-term debt, or a tax bill, that need to be paid within 12 months. The ROCE equation subtracts current liabilities from capital employed, so a company with a lot of current liabilities appears to have less capital employed, and a higher ROCE than otherwise. To check the impact of this, we calculate if a company has high current liabilities relative to its total assets.
Lum Chang Holdings has total liabilities of S$134m and total assets of S$608m. As a result, its current liabilities are equal to approximately 22% of its total assets. This is a modest level of current liabilities, which will have a limited impact on the ROCE.
What We Can Learn From Lum Chang Holdings’s ROCE
Lum Chang Holdings has a poor ROCE, and there may be better investment prospects out there. Of course, you might find a fantastic investment by looking at a few good candidates. So take a peek at this free list of companies with modest (or no) debt, trading on a P/E below 20.
If you are like me, then you will not want to miss this free list of growing companies that insiders are buying.
To help readers see past the short term volatility of the financial market, we aim to bring you a long-term focused research analysis purely driven by fundamental data. Note that our analysis does not factor in the latest price-sensitive company announcements.
The author is an independent contributor and at the time of publication had no position in the stocks mentioned. For errors that warrant correction please contact the editor at editorial-team@simplywallst.com.
