Is Lycopodium Limited's (ASX:LYL) Recent Stock Performance Influenced By Its Fundamentals In Any Way?
Lycopodium (ASX:LYL) has had a great run on the share market with its stock up by a significant 13% over the last three months. We wonder if and what role the company's financials play in that price change as a company's long-term fundamentals usually dictate market outcomes. Particularly, we will be paying attention to Lycopodium's ROE today.
ROE or return on equity is a useful tool to assess how effectively a company can generate returns on the investment it received from its shareholders. In simpler terms, it measures the profitability of a company in relation to shareholder's equity.
Check out our latest analysis for Lycopodium
How Do You Calculate Return On Equity?
ROE can be calculated by using the formula:
Return on Equity = Net Profit (from continuing operations) ÷ Shareholders' Equity
So, based on the above formula, the ROE for Lycopodium is:
27% = AU$27m ÷ AU$100m (Based on the trailing twelve months to June 2022).
The 'return' is the income the business earned over the last year. So, this means that for every A$1 of its shareholder's investments, the company generates a profit of A$0.27.
What Is The Relationship Between ROE And Earnings Growth?
So far, we've learned that ROE is a measure of a company's profitability. Depending on how much of these profits the company reinvests or "retains", and how effectively it does so, we are then able to assess a company’s earnings growth potential. Generally speaking, other things being equal, firms with a high return on equity and profit retention, have a higher growth rate than firms that don’t share these attributes.
A Side By Side comparison of Lycopodium's Earnings Growth And 27% ROE
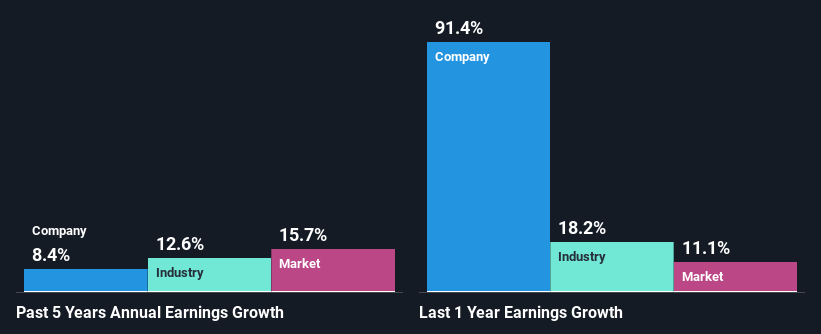
Firstly, we acknowledge that Lycopodium has a significantly high ROE. Second, a comparison with the average ROE reported by the industry of 14% also doesn't go unnoticed by us. This likely paved the way for the modest 8.4% net income growth seen by Lycopodium over the past five years. growth
As a next step, we compared Lycopodium's net income growth with the industry and were disappointed to see that the company's growth is lower than the industry average growth of 13% in the same period.
Earnings growth is a huge factor in stock valuation. What investors need to determine next is if the expected earnings growth, or the lack of it, is already built into the share price. Doing so will help them establish if the stock's future looks promising or ominous. One good indicator of expected earnings growth is the P/E ratio which determines the price the market is willing to pay for a stock based on its earnings prospects. So, you may want to check if Lycopodium is trading on a high P/E or a low P/E, relative to its industry.
Is Lycopodium Efficiently Re-investing Its Profits?
While Lycopodium has a three-year median payout ratio of 69% (which means it retains 31% of profits), the company has still seen a fair bit of earnings growth in the past, meaning that its high payout ratio hasn't hampered its ability to grow.
Besides, Lycopodium has been paying dividends for at least ten years or more. This shows that the company is committed to sharing profits with its shareholders.
Summary
In total, it does look like Lycopodium has some positive aspects to its business. The company has grown its earnings moderately as previously discussed. Still, the high ROE could have been even more beneficial to investors had the company been reinvesting more of its profits. As highlighted earlier, the current reinvestment rate appears to be quite low. Up till now, we've only made a short study of the company's growth data. So it may be worth checking this free detailed graph of Lycopodium's past earnings, as well as revenue and cash flows to get a deeper insight into the company's performance.
Have feedback on this article? Concerned about the content? Get in touch with us directly. Alternatively, email editorial-team (at) simplywallst.com.
This article by Simply Wall St is general in nature. We provide commentary based on historical data and analyst forecasts only using an unbiased methodology and our articles are not intended to be financial advice. It does not constitute a recommendation to buy or sell any stock, and does not take account of your objectives, or your financial situation. We aim to bring you long-term focused analysis driven by fundamental data. Note that our analysis may not factor in the latest price-sensitive company announcements or qualitative material. Simply Wall St has no position in any stocks mentioned.
Join A Paid User Research Session
You’ll receive a US$30 Amazon Gift card for 1 hour of your time while helping us build better investing tools for the individual investors like yourself. Sign up here
