Marathon Oil (MRO): A Comprehensive Analysis of Its Market Value
Marathon Oil Corp (NYSE:MRO) recently experienced a daily gain of 1.93% and a 3-month gain of 18.08%. With an Earnings Per Share (EPS) of 3.17, the question arises: is the stock fairly valued? This article provides a thorough valuation analysis of Marathon Oil, offering insights into the company's financial health, growth prospects, and intrinsic value. We encourage you to read on for a comprehensive understanding of Marathon Oil's market value.
Company Introduction
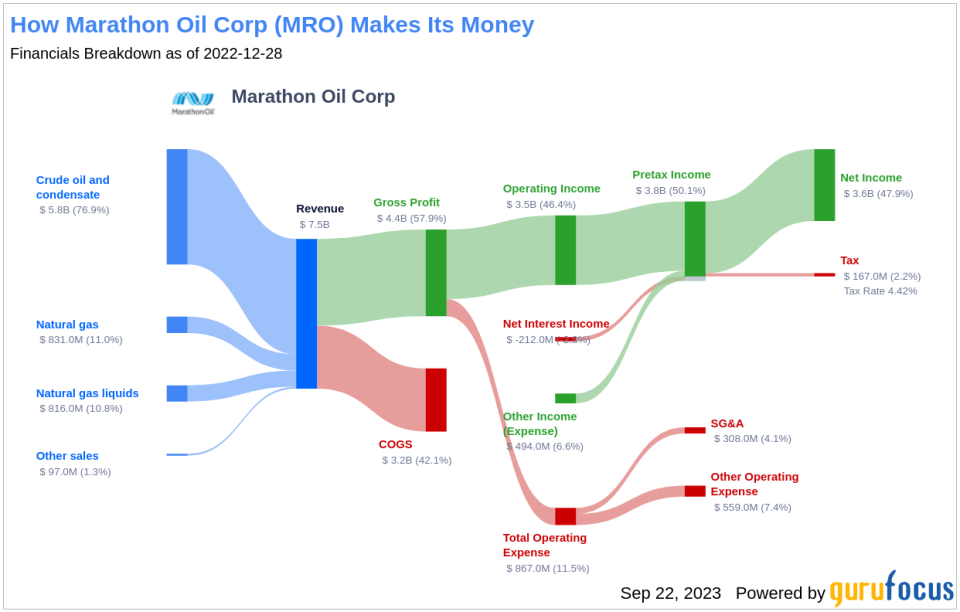
Marathon Oil Corp (NYSE:MRO) is an independent exploration and production company with a primary focus on unconventional resources in the United States. As of the end of 2022, Marathon Oil reported net proved reserves of 1.3 billion barrels of oil equivalent and a net production average of 343 thousand barrels of oil equivalent per day. The company's production ratio is 70% oil and NGLs and 30% natural gas.
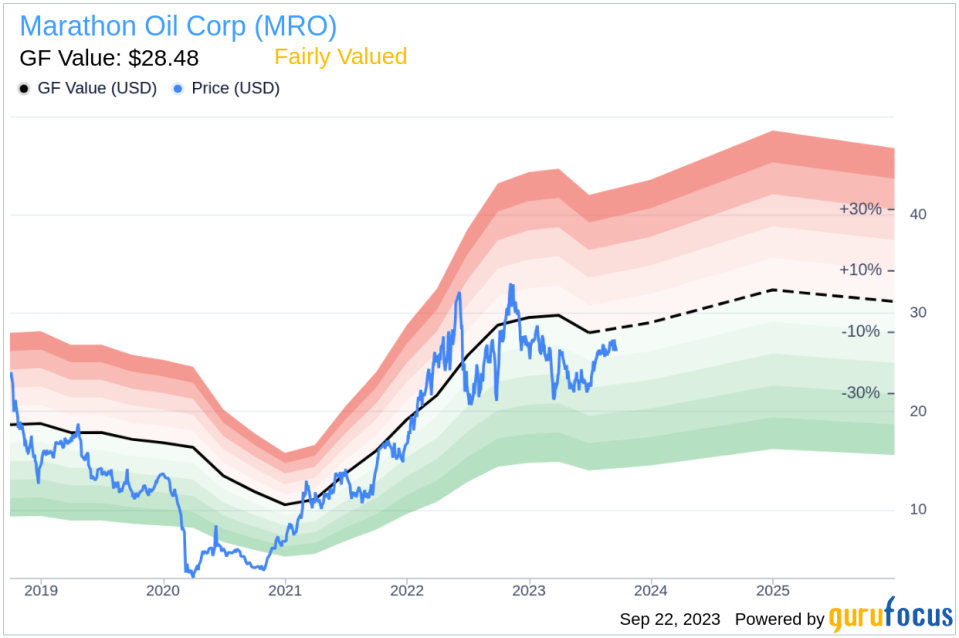
With a current share price of $26.37, Marathon Oil has a market cap of $16 billion. This price is compared against the GF Value, an estimation of the stock's fair value. The GF Value is computed considering historical trading multiples, a GuruFocus adjustment factor based on past performance and growth, and future business performance estimates. This comparison forms the basis for a profound exploration of the company's value.
Understanding the GF Value
The GF Value represents the intrinsic value of a stock, derived from a proprietary method. This method takes into account historical multiples (PE Ratio, PS Ratio, PB Ratio, and Price-to-Free-Cash-Flow) at which the stock has traded, a GuruFocus adjustment factor based on the company's past returns and growth, and future estimates of the business performance.
Marathon Oil's GF Value suggests that the stock is fairly valued. This is based on three key factors: historical multiples, an internal adjustment based on the company's past business growth, and analyst estimates of future business performance. If the stock's share price is significantly above the GF Value Line, the stock may be overvalued and have poor future returns. Conversely, if the stock's share price is significantly below the GF Value Line, the stock may be undervalued and have high future returns. Given Marathon Oil's current price of $26.37 per share and a market cap of $16 billion, the stock appears to be fairly valued.
As Marathon Oil is fairly valued, the long-term return of its stock is likely to be close to the rate of its business growth.
Marathon Oil's Financial Strength
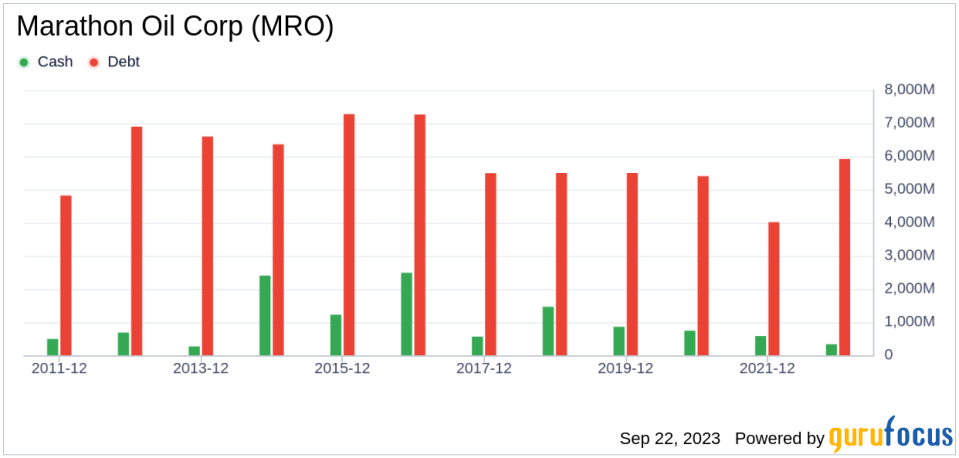
Investing in companies with low financial strength could result in permanent capital loss. Therefore, it's crucial to review a company's financial strength before deciding to buy shares. A good starting point is to look at the cash-to-debt ratio and interest coverage. Marathon Oil has a cash-to-debt ratio of 0.04, which ranks worse than 87.81% of 1034 companies in the Oil & Gas industry. Based on this, GuruFocus ranks Marathon Oil's financial strength as 6 out of 10, suggesting a fair balance sheet.
Profitability and Growth
Investing in profitable companies, especially those with consistent profitability over the long term, is less risky. A company with high profit margins is typically a safer investment than those with low profit margins. Marathon Oil has been profitable 6 times over the past 10 years. Over the past twelve months, the company had a revenue of $6.70 billion and Earnings Per Share (EPS) of $3.17. Its operating margin is 36.6%, which ranks better than 79.98% of 984 companies in the Oil & Gas industry. Overall, the profitability of Marathon Oil is ranked 6 out of 10, indicating fair profitability.
One of the most important factors in the valuation of a company is growth. Long-term stock performance is closely correlated with growth according to GuruFocus research. Companies that grow faster create more value for shareholders, especially if that growth is profitable. The average annual revenue growth of Marathon Oil is 20.6%, which ranks better than 72.13% of 861 companies in the Oil & Gas industry. The 3-year average EBITDA growth is 30.3%, which ranks better than 67.59% of 830 companies in the Oil & Gas industry.
ROIC vs WACC
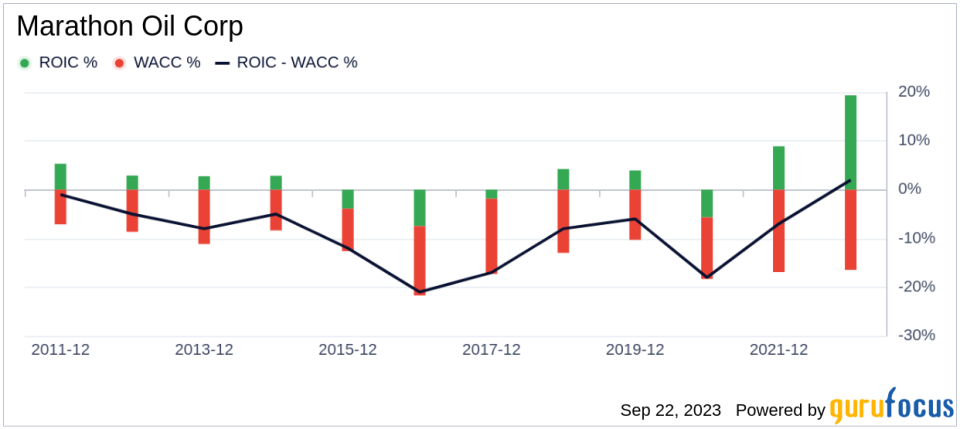
Another way to evaluate a company's profitability is to compare its return on invested capital (ROIC) and the weighted cost of capital (WACC). Return on invested capital (ROIC) measures how well a company generates cash flow relative to the capital it has invested in its business. The weighted average cost of capital (WACC) is the rate that a company is expected to pay on average to all its security holders to finance its assets. Ideally, the return on invested capital should be higher than the weighted cost of capital. For the past 12 months, Marathon Oil's return on invested capital is 10.67, and its cost of capital is 11.87.
Conclusion
Overall, Marathon Oil (NYSE:MRO) stock appears to be fairly valued. The company's financial condition is fair, and its profitability is fair. Its growth ranks better than 67.59% of 830 companies in the Oil & Gas industry. To learn more about Marathon Oil stock, you can check out its 30-Year Financials here.
To find out the high quality companies that may deliver above-average returns, please check out GuruFocus High Quality Low Capex Screener.
This article first appeared on GuruFocus.
