Has Marcus & Millichap, Inc.'s (NYSE:MMI) Impressive Stock Performance Got Anything to Do With Its Fundamentals?
Marcus & Millichap's (NYSE:MMI) stock is up by a considerable 18% over the past three months. Given that stock prices are usually aligned with a company's financial performance in the long-term, we decided to study its financial indicators more closely to see if they had a hand to play in the recent price move. Specifically, we decided to study Marcus & Millichap's ROE in this article.
Return on Equity or ROE is a test of how effectively a company is growing its value and managing investors’ money. In other words, it is a profitability ratio which measures the rate of return on the capital provided by the company's shareholders.
Check out our latest analysis for Marcus & Millichap
How Do You Calculate Return On Equity?
The formula for return on equity is:
Return on Equity = Net Profit (from continuing operations) ÷ Shareholders' Equity
So, based on the above formula, the ROE for Marcus & Millichap is:
9.6% = US$66m ÷ US$682m (Based on the trailing twelve months to March 2023).
The 'return' refers to a company's earnings over the last year. That means that for every $1 worth of shareholders' equity, the company generated $0.10 in profit.
What Is The Relationship Between ROE And Earnings Growth?
We have already established that ROE serves as an efficient profit-generating gauge for a company's future earnings. We now need to evaluate how much profit the company reinvests or "retains" for future growth which then gives us an idea about the growth potential of the company. Generally speaking, other things being equal, firms with a high return on equity and profit retention, have a higher growth rate than firms that don’t share these attributes.
Marcus & Millichap's Earnings Growth And 9.6% ROE
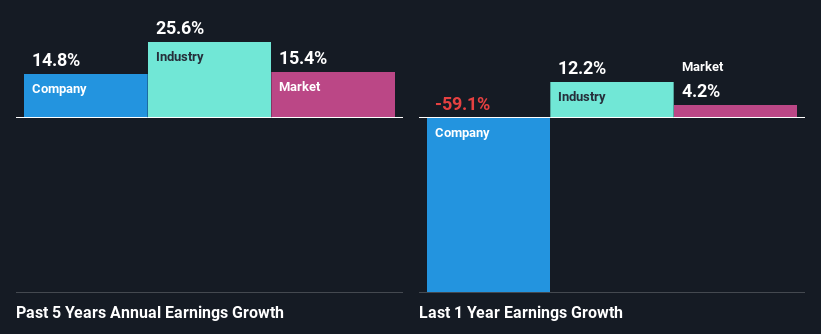
When you first look at it, Marcus & Millichap's ROE doesn't look that attractive. However, its ROE is similar to the industry average of 9.0%, so we won't completely dismiss the company. Even so, Marcus & Millichap has shown a fairly decent growth in its net income which grew at a rate of 15%. Given the slightly low ROE, it is likely that there could be some other aspects that are driving this growth. Such as - high earnings retention or an efficient management in place.
Next, on comparing with the industry net income growth, we found that Marcus & Millichap's reported growth was lower than the industry growth of 26% over the last few years, which is not something we like to see.
The basis for attaching value to a company is, to a great extent, tied to its earnings growth. It’s important for an investor to know whether the market has priced in the company's expected earnings growth (or decline). By doing so, they will have an idea if the stock is headed into clear blue waters or if swampy waters await. Is Marcus & Millichap fairly valued compared to other companies? These 3 valuation measures might help you decide.
Is Marcus & Millichap Using Its Retained Earnings Effectively?
Marcus & Millichap has a low three-year median payout ratio of 13%, meaning that the company retains the remaining 87% of its profits. This suggests that the management is reinvesting most of the profits to grow the business.
While Marcus & Millichap has seen growth in its earnings, it only recently started to pay a dividend. It is most likely that the company decided to impress new and existing shareholders with a dividend.
Conclusion
In total, it does look like Marcus & Millichap has some positive aspects to its business. That is, a decent growth in earnings backed by a high rate of reinvestment. However, we do feel that that earnings growth could have been higher if the business were to improve on the low ROE rate. Especially given how the company is reinvesting a huge chunk of its profits. With that said, the latest industry analyst forecasts reveal that the company's earnings growth is expected to slow down. To know more about the latest analysts predictions for the company, check out this visualization of analyst forecasts for the company.
Have feedback on this article? Concerned about the content? Get in touch with us directly. Alternatively, email editorial-team (at) simplywallst.com.
This article by Simply Wall St is general in nature. We provide commentary based on historical data and analyst forecasts only using an unbiased methodology and our articles are not intended to be financial advice. It does not constitute a recommendation to buy or sell any stock, and does not take account of your objectives, or your financial situation. We aim to bring you long-term focused analysis driven by fundamental data. Note that our analysis may not factor in the latest price-sensitive company announcements or qualitative material. Simply Wall St has no position in any stocks mentioned.
Join A Paid User Research Session
You’ll receive a US$30 Amazon Gift card for 1 hour of your time while helping us build better investing tools for the individual investors like yourself. Sign up here
