The Market Lifts 17 Education & Technology Group Inc. (NASDAQ:YQ) Shares 27% But It Can Do More
17 Education & Technology Group Inc. (NASDAQ:YQ) shareholders are no doubt pleased to see that the share price has bounced 27% in the last month, although it is still struggling to make up recently lost ground. Not all shareholders will be feeling jubilant, since the share price is still down a very disappointing 39% in the last twelve months.
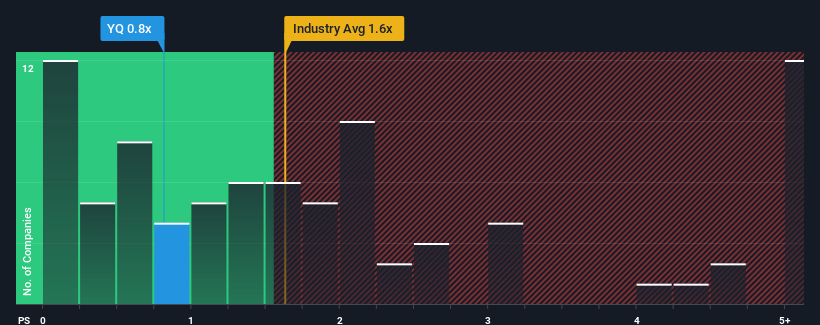
In spite of the firm bounce in price, it would still be understandable if you think 17 Education & Technology Group is a stock with good investment prospects with a price-to-sales ratios (or "P/S") of 0.8x, considering almost half the companies in the United States' Consumer Services industry have P/S ratios above 1.6x. Although, it's not wise to just take the P/S at face value as there may be an explanation why it's limited.
See our latest analysis for 17 Education & Technology Group
What Does 17 Education & Technology Group's Recent Performance Look Like?
For example, consider that 17 Education & Technology Group's financial performance has been poor lately as its revenue has been in decline. One possibility is that the P/S is low because investors think the company won't do enough to avoid underperforming the broader industry in the near future. If you like the company, you'd be hoping this isn't the case so that you could potentially pick up some stock while it's out of favour.
Although there are no analyst estimates available for 17 Education & Technology Group, take a look at this free data-rich visualisation to see how the company stacks up on earnings, revenue and cash flow.
Is There Any Revenue Growth Forecasted For 17 Education & Technology Group?
17 Education & Technology Group's P/S ratio would be typical for a company that's only expected to deliver limited growth, and importantly, perform worse than the industry.
In reviewing the last year of financials, we were disheartened to see the company's revenues fell to the tune of 76%. Still, the latest three year period has seen an excellent 31% overall rise in revenue, in spite of its unsatisfying short-term performance. Accordingly, while they would have preferred to keep the run going, shareholders would definitely welcome the medium-term rates of revenue growth.
Weighing that recent medium-term revenue trajectory against the broader industry's one-year forecast for expansion of 8.8% shows it's about the same on an annualised basis.
With this information, we find it odd that 17 Education & Technology Group is trading at a P/S lower than the industry. Apparently some shareholders are more bearish than recent times would indicate and have been accepting lower selling prices.
What We Can Learn From 17 Education & Technology Group's P/S?
Despite 17 Education & Technology Group's share price climbing recently, its P/S still lags most other companies. It's argued the price-to-sales ratio is an inferior measure of value within certain industries, but it can be a powerful business sentiment indicator.
The fact that 17 Education & Technology Group currently trades at a low P/S relative to the industry is unexpected considering its recent three-year growth is in line with the wider industry forecast. When we see industry-like revenue growth but a lower than expected P/S, we assume potential risks are what might be placing downward pressure on the share price. revenue trends suggest that the risk of a price decline is low, investors appear to perceive a possibility of revenue volatility in the future.
Before you take the next step, you should know about the 1 warning sign for 17 Education & Technology Group that we have uncovered.
If strong companies turning a profit tickle your fancy, then you'll want to check out this free list of interesting companies that trade on a low P/E (but have proven they can grow earnings).
Have feedback on this article? Concerned about the content? Get in touch with us directly. Alternatively, email editorial-team (at) simplywallst.com.
This article by Simply Wall St is general in nature. We provide commentary based on historical data and analyst forecasts only using an unbiased methodology and our articles are not intended to be financial advice. It does not constitute a recommendation to buy or sell any stock, and does not take account of your objectives, or your financial situation. We aim to bring you long-term focused analysis driven by fundamental data. Note that our analysis may not factor in the latest price-sensitive company announcements or qualitative material. Simply Wall St has no position in any stocks mentioned.
Join A Paid User Research Session
You’ll receive a US$30 Amazon Gift card for 1 hour of your time while helping us build better investing tools for the individual investors like yourself. Sign up here
