Marsh & McLennan Companies Inc's Dividend Analysis: A Deep Dive into Its Performance and ...
Exploring the Dividend History, Yield, Growth, and Sustainability of Marsh & McLennan Companies Inc
Marsh & McLennan Companies Inc(NYSE:MMC) recently announced a dividend of $0.71 per share, payable on 2023-11-15, with the ex-dividend date set for 2023-10-05. As investors look forward to this upcoming payment, the spotlight also shines on the company's dividend history, yield, and growth rates. Using the data from GuruFocus, let's deep dive into Marsh & McLennan Companies Inc's dividend performance and assess its sustainability.
What Does Marsh & McLennan Companies Inc Do?
Warning! GuruFocus has detected 4 Warning Sign with MMC. Click here to check it out.
This Powerful Chart Made Peter Lynch 29% A Year For 13 Years
How to calculate the intrinsic value of a stock?
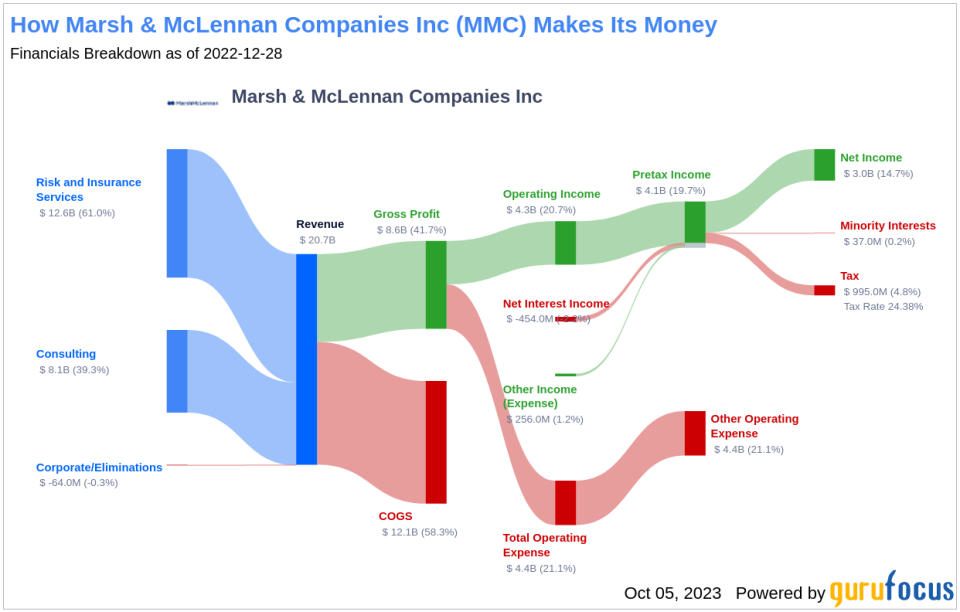
Marsh McLennan is a professional-services firm that provides advice and solutions in the areas of risk, strategy, and human capital. The company operates through two main segments: risk and insurance services and consulting. In risk and insurance services, the firm offers services via Marsh (an insurance broker) and Guy Carpenter (a risk and reinsurance specialist). The consulting division comprises Mercer (a provider of human resource services) and Oliver Wyman (a management and economic consultancy). About half of its revenue is generated outside the U.S.
A Glimpse at Marsh & McLennan Companies Inc's Dividend History
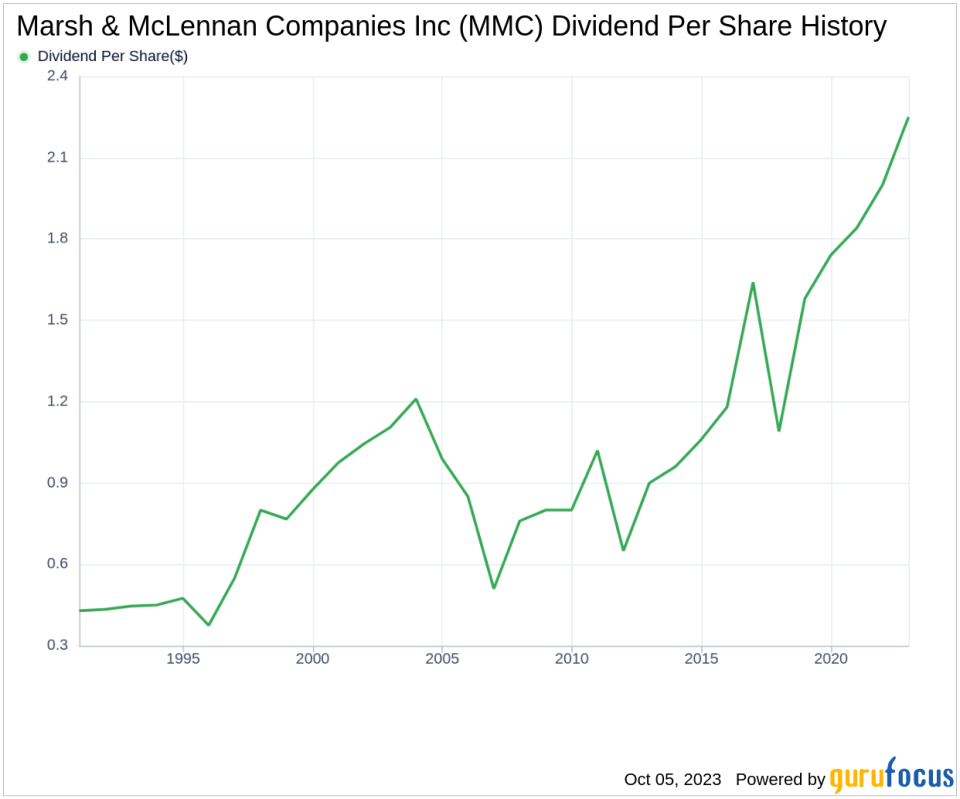
Marsh & McLennan Companies Inc has maintained a consistent dividend payment record since 1985. Dividends are currently distributed on a quarterly basis. Below is a chart showing annual Dividends Per Share for tracking historical trends.
Breaking Down Marsh & McLennan Companies Inc's Dividend Yield and Growth
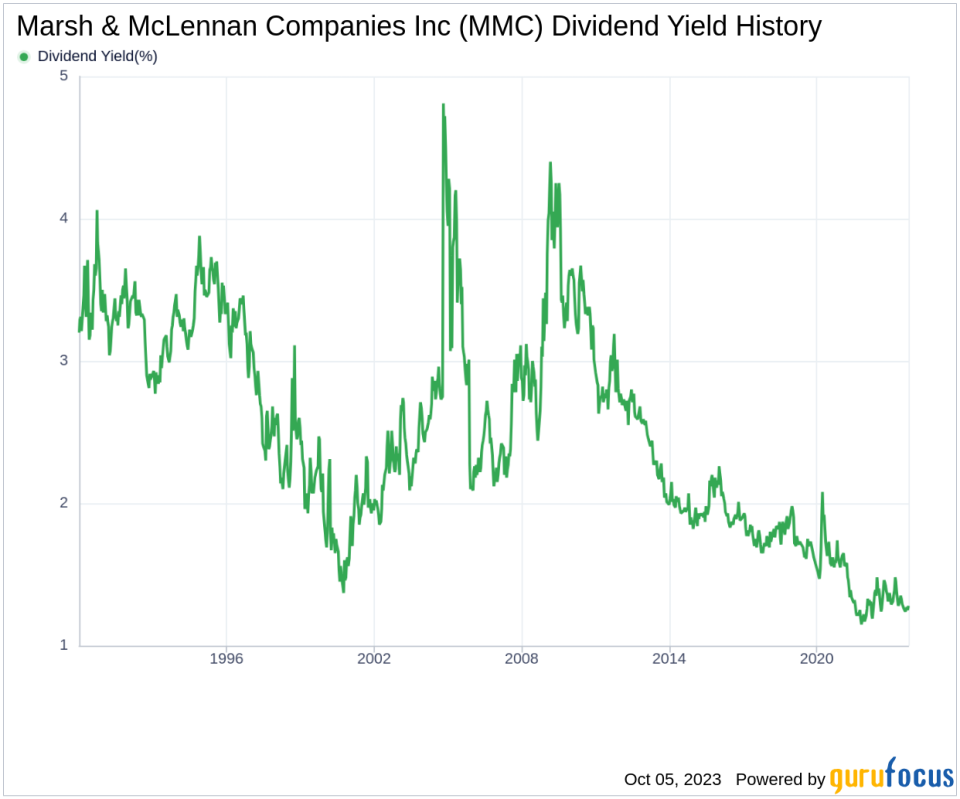
As of today, Marsh & McLennan Companies Inc currently has a 12-month trailing dividend yield of 1.30% and a 12-month forward dividend yield of 1.50%. This suggests an expectation of increased dividend payments over the next 12 months.
Over the past three years, Marsh & McLennan Companies Inc's annual dividend growth rate was 8.90%. Extended to a five-year horizon, this rate increased to 13.40% per year. And over the past decade, Marsh & McLennan Companies Inc's annual dividends per share growth rate stands at 9.40%.
Based on Marsh & McLennan Companies Inc's dividend yield and five-year growth rate, the 5-year yield on cost of Marsh & McLennan Companies Inc stock as of today is approximately 2.44%.
The Sustainability Question: Payout Ratio and Profitability
To assess the sustainability of the dividend, one needs to evaluate the company's payout ratio. The dividend payout ratio provides insights into the portion of earnings the company distributes as dividends. A lower ratio suggests that the company retains a significant part of its earnings, thereby ensuring the availability of funds for future growth and unexpected downturns. As of 2023-06-30, Marsh & McLennan Companies Inc's dividend payout ratio is 0.36.
Marsh & McLennan Companies Inc's profitability rank, offers an understanding of the company's earnings prowess relative to its peers. GuruFocus ranks Marsh & McLennan Companies Inc's profitability 9 out of 10 as of 2023-06-30, suggesting good profitability prospects. The company has reported positive net income for each year over the past decade, further solidifying its high profitability.
Growth Metrics: The Future Outlook
To ensure the sustainability of dividends, a company must have robust growth metrics. Marsh & McLennan Companies Inc's growth rank of 9 out of 10 suggests that the company's growth trajectory is good relative to its competitors.
Revenue is the lifeblood of any company, and Marsh & McLennan Companies Inc's revenue per share, combined with the 3-year revenue growth rate, indicates a strong revenue model. Marsh & McLennan Companies Inc's revenue has increased by approximately 8.00% per year on average, a rate that outperforms approximately 63.54% of global competitors.
The company's 3-year EPS growth rate showcases its capability to grow its earnings, a critical component for sustaining dividends in the long run. During the past three years, Marsh & McLennan Companies Inc's earnings increased by approximately 21.00% per year on average, a rate that outperforms approximately 76.63% of global competitors.
Lastly, the company's 5-year EBITDA growth rate of 18.00% outperforms approximately 80.62% of global competitors.
Next Steps
Marsh & McLennan Companies Inc's consistent dividend payments, impressive growth rate, reasonable payout ratio, high profitability, and robust growth metrics suggest that its dividend is sustainable and likely to grow in the future. Investors seeking a steady income stream may find Marsh & McLennan Companies Inc an interesting prospect. However, as with any investment, it's crucial to conduct comprehensive research and consider the overall health and prospects of the company before making a decision.
GuruFocus Premium users can screen for high-dividend yield stocks using the High Dividend Yield Screener.
This article first appeared on GuruFocus.
