Mayne Pharma Group (ASX:MYX shareholders incur further losses as stock declines 13% this week, taking five-year losses to 72%
Mayne Pharma Group Limited (ASX:MYX) shareholders should be happy to see the share price up 27% in the last quarter. But will that heal all the wounds inflicted over 5 years of declines? Unlikely. Five years have seen the share price descend precipitously, down a full 75%. The recent bounce might mean the long decline is over, but we are not confident. The fundamental business performance will ultimately determine if the turnaround can be sustained.
With the stock having lost 13% in the past week, it's worth taking a look at business performance and seeing if there's any red flags.
View our latest analysis for Mayne Pharma Group
Because Mayne Pharma Group made a loss in the last twelve months, we think the market is probably more focussed on revenue and revenue growth, at least for now. Shareholders of unprofitable companies usually expect strong revenue growth. That's because it's hard to be confident a company will be sustainable if revenue growth is negligible, and it never makes a profit.
In the last five years Mayne Pharma Group saw its revenue shrink by 8.8% per year. That's definitely a weaker result than most pre-profit companies report. So it's not altogether surprising to see the share price down 12% per year in the same time period. This kind of price performance makes us very wary, especially when combined with falling revenue. Ironically, that behavior could create an opportunity for the contrarian investor - but only if there are good reasons to predict a brighter future.
The image below shows how earnings and revenue have tracked over time (if you click on the image you can see greater detail).
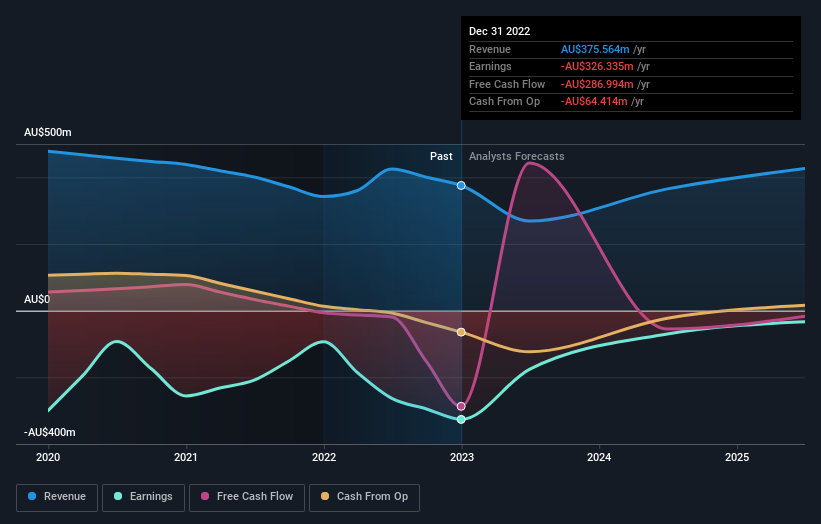
It's probably worth noting we've seen significant insider buying in the last quarter, which we consider a positive. On the other hand, we think the revenue and earnings trends are much more meaningful measures of the business. If you are thinking of buying or selling Mayne Pharma Group stock, you should check out this free report showing analyst profit forecasts.
What About The Total Shareholder Return (TSR)?
We'd be remiss not to mention the difference between Mayne Pharma Group's total shareholder return (TSR) and its share price return. Arguably the TSR is a more complete return calculation because it accounts for the value of dividends (as if they were reinvested), along with the hypothetical value of any discounted capital that have been offered to shareholders. Mayne Pharma Group hasn't been paying dividends, but its TSR of -72% exceeds its share price return of -75%, implying it has either spun-off a business, or raised capital at a discount; thereby providing additional value to shareholders.
A Different Perspective
Investors in Mayne Pharma Group had a tough year, with a total loss of 27%, against a market gain of about 5.7%. However, keep in mind that even the best stocks will sometimes underperform the market over a twelve month period. Regrettably, last year's performance caps off a bad run, with the shareholders facing a total loss of 11% per year over five years. Generally speaking long term share price weakness can be a bad sign, though contrarian investors might want to research the stock in hope of a turnaround. It's always interesting to track share price performance over the longer term. But to understand Mayne Pharma Group better, we need to consider many other factors. Take risks, for example - Mayne Pharma Group has 2 warning signs we think you should be aware of.
If you like to buy stocks alongside management, then you might just love this free list of companies. (Hint: insiders have been buying them).
Please note, the market returns quoted in this article reflect the market weighted average returns of stocks that currently trade on Australian exchanges.
Have feedback on this article? Concerned about the content? Get in touch with us directly. Alternatively, email editorial-team (at) simplywallst.com.
This article by Simply Wall St is general in nature. We provide commentary based on historical data and analyst forecasts only using an unbiased methodology and our articles are not intended to be financial advice. It does not constitute a recommendation to buy or sell any stock, and does not take account of your objectives, or your financial situation. We aim to bring you long-term focused analysis driven by fundamental data. Note that our analysis may not factor in the latest price-sensitive company announcements or qualitative material. Simply Wall St has no position in any stocks mentioned.
Join A Paid User Research Session
You’ll receive a US$30 Amazon Gift card for 1 hour of your time while helping us build better investing tools for the individual investors like yourself. Sign up here
