Can McCarthy & Stone plc (LON:MCS) Improve Its Returns?

One of the best investments we can make is in our own knowledge and skill set. With that in mind, this article will work through how we can use Return On Equity (ROE) to better understand a business. By way of learning-by-doing, we’ll look at ROE to gain a better understanding of McCarthy & Stone plc (LON:MCS).
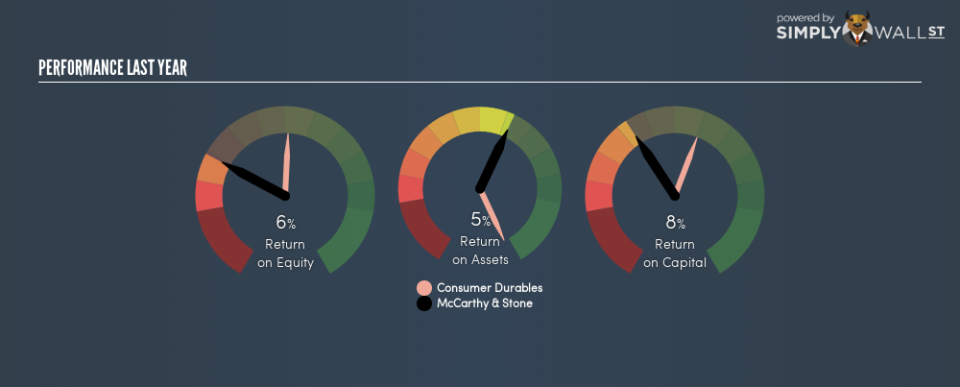
McCarthy & Stone has a ROE of 6.1%, based on the last twelve months. One way to conceptualize this, is that for each £1 of shareholders’ equity it has, the company made £0.061 in profit.
Check out our latest analysis for McCarthy & Stone
How Do You Calculate Return On Equity?
The formula for ROE is:
Return on Equity = Net Profit ÷ Shareholders’ Equity
Or for McCarthy & Stone:
6.1% = 46.2 ÷ UK£763m (Based on the trailing twelve months to August 2018.)
Most know that net profit is the total earnings after all expenses, but the concept of shareholders’ equity is a little more complicated. It is all the money paid into the company from shareholders, plus any earnings retained. Shareholders’ equity can be calculated by subtracting the total liabilities of the company from the total assets of the company.
What Does Return On Equity Signify?
ROE measures a company’s profitability against the profit it retains, and any outside investments. The ‘return’ is the amount earned after tax over the last twelve months. That means that the higher the ROE, the more profitable the company is. So, as a general rule, a high ROE is a good thing. That means it can be interesting to compare the ROE of different companies.
Does McCarthy & Stone Have A Good ROE?
By comparing a company’s ROE with its industry average, we can get a quick measure of how good it is. However, this method is only useful as a rough check, because companies do differ quite a bit within the same industry classification. As shown in the graphic below, McCarthy & Stone has a lower ROE than the average (16%) in the Consumer Durables industry classification.
That certainly isn’t ideal. We’d prefer see an ROE above the industry average, but it might not matter if the company is undervalued. Nonetheless, it might be wise to check if insiders have been selling.
How Does Debt Impact Return On Equity?
Most companies need money — from somewhere — to grow their profits. That cash can come from issuing shares, retained earnings, or debt. In the case of the first and second options, the ROE will reflect this use of cash, for growth. In the latter case, the debt used for growth will improve returns, but won’t affect the total equity. Thus the use of debt can improve ROE, albeit along with extra risk in the case of stormy weather, metaphorically speaking.
McCarthy & Stone’s Debt And Its 6.1% ROE
While McCarthy & Stone does have a tiny amount of debt, with debt to equity of just 0.067, we think the use of debt is very modest. Although the ROE isn’t overly impressive, the debt load is modest, suggesting the business has potential. Conservative use of debt to boost returns is usually a good move for shareholders, though it does leave the company more exposed to interest rate rises.
But It’s Just One Metric
Return on equity is one way we can compare the business quality of different companies. In my book the highest quality companies have high return on equity, despite low debt. If two companies have around the same level of debt to equity, and one has a higher ROE, I’d generally prefer the one with higher ROE.
But ROE is just one piece of a bigger puzzle, since high quality businesses often trade on high multiples of earnings. The rate at which profits are likely to grow, relative to the expectations of profit growth reflected in the current price, must be considered, too. So you might want to check this FREE visualization of analyst forecasts for the company.
Of course, you might find a fantastic investment by looking elsewhere. So take a peek at this free list of interesting companies.
To help readers see past the short term volatility of the financial market, we aim to bring you a long-term focused research analysis purely driven by fundamental data. Note that our analysis does not factor in the latest price-sensitive company announcements.
The author is an independent contributor and at the time of publication had no position in the stocks mentioned. For errors that warrant correction please contact the editor at editorial-team@simplywallst.com.
