Is Mercury Systems (MRCY) Too Good to Be True? A Comprehensive Analysis of a Potential Value Trap
Value-focused investors are always on the hunt for stocks that are priced below their intrinsic value. One such stock that merits attention is Mercury Systems Inc (NASDAQ:MRCY). The stock, which is currently priced at 38.35, recorded a gain of 5.62% in a day and a 3-month increase of 13.68%. The stock's fair valuation is $56.07, as indicated by its GF Value.
Understanding GF Value
The GF Value represents the current intrinsic value of a stock derived from our exclusive method. The GF Value Line on our summary page gives an overview of the fair value that the stock should be traded at. It is calculated based on three factors: historical multiples (PE Ratio, PS Ratio, PB Ratio and Price-to-Free-Cash-Flow) that the stock has traded at, GuruFocus adjustment factor based on the company's past returns and growth, and future estimates of the business performance.
We believe the GF Value Line is the fair value that the stock should be traded at. The stock price will most likely fluctuate around the GF Value Line. If the stock price is significantly above the GF Value Line, it is overvalued and its future return is likely to be poor. On the other hand, if it is significantly below the GF Value Line, its future return will likely be higher.
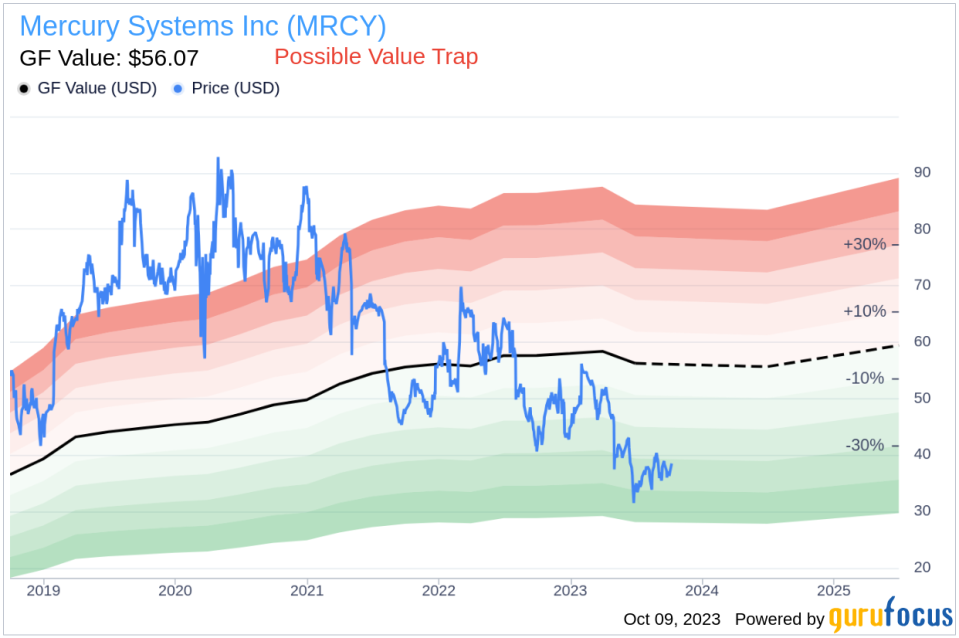
However, investors need to consider a more in-depth analysis before making an investment decision. Despite its seemingly attractive valuation, certain risk factors associated with Mercury Systems should not be ignored. These risks are primarily reflected through its low Piotroski F-score of 1. These indicators suggest that Mercury Systems, despite its apparent undervaluation, might be a potential value trap. This complexity underlines the importance of thorough due diligence in investment decision-making.
Deciphering the Piotroski F-score
The Piotroski F-score, created by accounting professor Joseph Piotroski, is a tool used to assess the strength of a company's financial health. The score is based on nine criteria that fall into three categories: profitability, leverage/liquidity/ source of funds, and operating efficiency. The overall score ranges from 0 to 9, with higher scores indicating healthier financials. Mercury Systems's current Piotroski F-Score, however, falls in the lower end of this spectrum, indicating potential red flags for investors.
Company Introduction
Mercury Systems Inc is a commercial technology company serving the aerospace and defense industry. The company envisions, creates and delivers secure open architecture solutions powering a broad range of mission-critical applications in the challenging and demanding environments. Inspired by its purpose of delivering Innovation that Matters, By and For People Who Matter, Mercury helps make the world a safer, more secure place for all.
When comparing the stock price and the GF Value, the latter is an estimation of fair value. This comparison paves the way for a more profound exploration of the company's value, ingeniously integrating financial assessment with essential company details.
Analysis of Mercury Systems's Profitability
Firstly, let's address profitability. One significant component of the F-Score is a positive return on assets (ROA). A closer look at Mercury Systems's ROA reveals a worrying trend of negative returns. This indicates the company's inability to generate profit from its assets - a fundamental concern for any investor.
Let's delve deeper into Mercury Systems's financial health by examining the decline in its return on assets (ROA) over the past three years. The data indicates 2021: 3.42; 2022: 0.53; 2023: -1.20, when expressed in percentages. Such a decrease is concerning, as the Piotroski F-Score penalizes companies with lower current ROA compared to the previous period. This ongoing decline highlights another potential risk associated with investing in Mercury Systems.
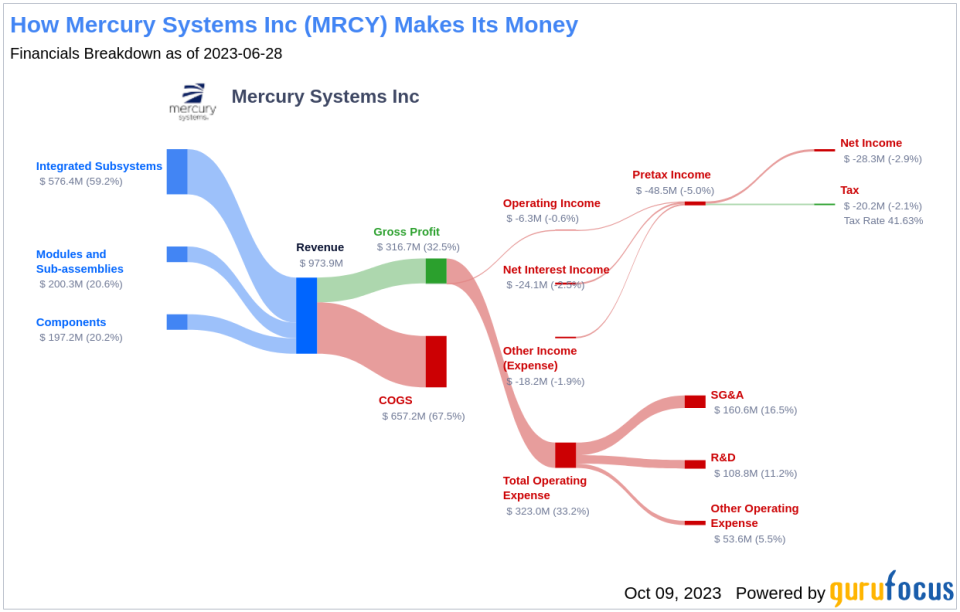
Observing the financials of Mercury Systems, it's important to note that the cash flow from operations over the trailing twelve months (TTM) stands at $-21.25 million, whereas the net income in the same period is significantly higher at $-28.34 million. The Piotroski F-score considers this discrepancy as a potential red flag. The rationale behind this is that a company's operating cash flow is a more direct and less manipulated measure of its cash-generating ability than net income. Net income, while important, is susceptible to accounting treatments and non-cash items which can distort the true cash profitability of the company. If a company consistently shows lower cash flows from operations relative to its net income, it could indicate that the earnings quality is poor and the company might have difficulties sustaining its operations or financing its obligations, a fact which could negatively impact its financial stability and investor confidence.
Leverage, Liquidity and Source of Funds: A Worrying Trend
Assessing the aspect of leverage, liquidity, and sources of funds, Mercury Systems demonstrates an alarming rise in its debt-to-total assets ratio over the past three years. The provided data shows 2021: 0.14; 2022: 0.23; 2023: 0.24, expressed as percentages. A higher debt ratio suggests that Mercury Systems is increasingly financing its assets through debt, thereby escalating its financial risk. The Piotroski F-Score views this as a negative indicator, further cautioning investors about Mercury Systems.

Examining Mercury Systems's financial stability, there's a notable decrease in its current ratio over the past three years, as shown by the data 2021: 4.26; 2022: 4.20; 2023: 4.02, which is expressed as percentages. The current ratio is a key indicator of a company's short-term financial health, as it gauges the ability to cover short-term liabilities with short-term assets. A declining current ratio suggests that Mercury Systems's liquidity and capability to manage immediate financial obligations are deteriorating.
Operating Efficiency: A Darker Picture
Examining the data provided: 2021: 55.59; 2022: 57.12; 2023: 57.29, it becomes evident that Mercury Systems has seen an increase in its Diluted Average Shares Outstanding over the past three years. This trend signals that the company has issued more shares. While issuing additional shares can provide immediate capital for the business, it can also lead to the dilution of existing shares' value. This dilution occurs because the earnings of the company now have to be divided among a larger pool of shares, which could decrease Earnings Per Share (EPS). Consequently, if the company's earnings don't grow at a pace that matches or exceeds this share increase, it could lead to a reduction in the value perceived by existing shareholders, potentially impacting their investment returns. Hence, while additional share issuance may provide necessary capital, it is important to monitor its impact on shareholder value carefully.
Lastly, concerning operating efficiency, the Piotroski F-score examines changes in gross margin and asset turnover. Regrettably, Mercury Systems follows a discouraging trajectory with a decrease in gross margin percentage over the past three years, as demonstrated by the data provided: 2021: 41.69; 2022: 39.97; 2023: 32.52 (expressed in percentages). This contraction in gross margin suggests that Mercury Systems is grappling with either an escalation in the cost of goods sold or dwindling prices - both of which are inauspicious indicators for profitability.
In terms of operational efficiency, another key indicator, Mercury Systems has unfortunately reported a declining trend in asset turnover over the past three years, as evidenced by the data: 2021: 0.51; 2022: 0.46; 2023: 0.41 (expressed in percentages). Asset turnover measures how effectively a company uses its assets to generate sales, and a decrease in this ratio can indicate a drop in efficiency. This could be due to various factors, such as underutilization of assets or a decline in the market demand for the company's products or services. Consequently, this downward trend in asset turnover implies that Mercury Systems may need to revisit its operational strategies to improve the utilization of its assets and boost its sales volume.
While the Piotroski F-score is not the only lens through which to view a potential investment, it is a robust and comprehensive tool for evaluating a company's financial health. Unfortunately for Mercury Systems, its current score suggests potential troubles. The company's declining ROA, the discrepancy between cash flow from operations and net income, the rising debt ratio, decreasing current ratio, increasing diluted average shares outstanding, decreasing gross margin percentage, and declining asset turnover are all concerning signals that potential investors should be aware of.
Conclusion
Despite Mercury Systems's seemingly attractive valuation, the company presents several risk factors that suggest it might be a potential value trap. Its low Piotroski F-score, coupled with various financial red flags, indicate that it may not be as profitable an investment as it may initially appear. Therefore, investors should conduct thorough due diligence and consider these risks before making an investment decision.
GuruFocus Premium members can find stocks with high Piotroski F-score using the following Screener: Piotroski F-score screener .
This article, generated by GuruFocus, is designed to provide general insights and is not tailored financial advice. Our commentary is rooted in historical data and analyst projections, utilizing an impartial methodology, and is not intended to serve as specific investment guidance. It does not formulate a recommendation to purchase or divest any stock and does not consider individual investment objectives or financial circumstances. Our objective is to deliver long-term, fundamental data-driven analysis. Be aware that our analysis might not incorporate the most recent, price-sensitive company announcements or qualitative information. GuruFocus holds no position in the stocks mentioned herein.
This article first appeared on GuruFocus.
