MetLife (MET) Q2 Earnings Beat on Higher Investment Returns
MetLife, Inc. MET reported second-quarter 2023 adjusted operating earnings of $1.94 per share, which beat the Zacks Consensus Estimate by 4.9%. The bottom line, however, declined 5% year over year.
Adjusted operating revenues of MetLife amounted to $18,634 million, which increased 3.5% year over year. The top line beat the consensus mark by 8.8%.
The better-than-expected second-quarter results were supported by higher investment returns, volume growth across some segments and improved contributions from the U.S. and EMEA businesses. The positives were partially offset by rising expenses and reduced profit levels from MetLife Holdings, Latin America and Asia businesses.
MetLife, Inc. Price, Consensus and EPS Surprise
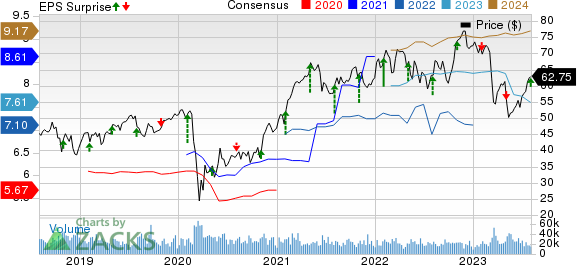
MetLife, Inc. price-consensus-eps-surprise-chart | MetLife, Inc. Quote
Behind the Headlines
Adjusted premiums, fees and other revenues, excluding pension risk transfer (PRT), were $11,570 million, up 6% year over year. Adjusted net investment income rose 12% year over year to $5,040 million in the quarter under review, despite decreased real estate equity returns.
Total expenses of $16,193 million jumped from $14,486 million a year ago and were 6.2% higher than our estimate, due to rising policyholder benefits and claims, and interest credited to policyholder account balances. The adjusted expense ratio, excluding total notable items related to adjusted other expenses and PRT, increased 80 basis points (bps) year over year to 20.6%.
Net income plunged 58% year over year to $370 million and missed our model estimate due to net investment losses. Adjusted return on equity, excluding AOCI other than FCTA, deteriorated 180 bps year over year to 14.6%.
Inside MetLife’s Segments
U.S.: The segment reported adjusted earnings of $789 million, which increased 1% year over year and beat our estimate of $706.5 million in the second quarter due to higher volume and recurring interest margins, partly offset by variable expenses and lower underwriting margins. Adjusted premiums, fees and other revenues, excluding PRT of $6,812 million, rose 10% year over year.
Asia: Adjusted earnings in the segment amounted to $431 million, which fell 11% year over year in the quarter under review, due to reduced variable investment income. However, the figure significantly beat our estimate. Adjusted premiums, fees & other revenues declined 6% year over year to $1,727 million in the second quarter.
Latin America: Adjusted earnings of $219 million decreased 13% from a year ago and missed our estimate of $236.2 million, due to capital market factors and a COVID-related reserve release in the year-ago period. Adjusted premiums, fees & other revenues advanced 23% year over year to $1,385 million in the segment, due to growing sales.
EMEA: The segment’s adjusted earnings were $70 million, which increased 6% at a reported basis and 15% at cc year over year in the second quarter, beating our estimate of $57.5 million on the back of growing recurring interest margins. Adjusted premiums, fees & other revenues of $582 million climbed 1% year over year. On a cc basis, the same was up 4% year over year due to sales growth.
MetLife Holdings: Adjusted earnings in the segment slumped 45% year over year to $211 million and missed our estimate of $277.6 million, due to decreased variable investment income. Adjusted premiums, fees & other revenues fell 13% year over year to $938 million in the quarter under review.
Corporate & Other: Adjusted loss of $228 million marginally widened from the prior-year quarter’s loss of $227 million.
Financial Update (as of Jun 30, 2023)
MetLife exited the second quarter with cash and cash equivalents of $15,417 million, which decreased from $20,195 million at 2022-end. Total assets of $677.3 billion increased from $663.1 billion at 2022-end.
Long-term debt totaled $14,539 million, down from $14,647 million at the prior-year end. It also had a short-term debt of $200 million. Total equity of $30,492 million increased from $30,125 million at 2022-end.
Capital Deployment Update
MetLife bought back shares worth $700 million during the second quarter and an additional $300 million in July.
Previous Outlook
Earlier, the company stated that it expects pre-tax variable investment income to be around $2 billion for 2023. Corporate & Other adjusted losses were expected within $650-$750 million for the year. The effective tax rate was projected in the range of 22-24%. MET expected MetLife Holdings’ adjusted premiums, fees and other revenues to decline 12-14% in 2023 and then by 6-8% per annum. It had expected to generate adjusted earnings of $1-$1.2 billion in 2023 from this segment.
It stated that within three years, the company targets adjusted return on equity within 13-15%. It intends to keep free cash flow within the 65-75% range of adjusted earnings. Further, it is aiming at a direct expense ratio of 12.6%. In the near term, MET expected its group benefits’ adjusted premiums, fees and other revenues to grow 4-6% per annum.
Zacks Rank & Key Picks
MetLife currently has a Zacks Rank #3 (Hold). Investors interested in the broader finance space can consider better-ranked companies like Ryan Specialty Holdings, Inc. RYAN, Employers Holdings, Inc. EIG and Marsh & McLennan Companies, Inc. MMC, each carrying a Zacks Rank #2 (Buy) at present. You can see the complete list of today’s Zacks #1 Rank (Strong Buy) stocks here.
Headquartered in Chicago, Ryan Specialty offers specialty products and solutions for different types of clients in the insurance industry. The Zacks Consensus Estimate for RYAN’s current year earnings indicates a 16.5% year-over-year increase. It beat earnings estimates in two of the past four quarters, met once and missed on the other occasion, with an average surprise of 2.7%.
Based in Reno, NV, Employers Holdings has vast operations in the commercial property and casualty insurance industry. The Zacks Consensus Estimate for EIG’s current-year bottom line is pegged at $3.23 per share, indicating a 10.2% jump from a year ago.
New York-based Marsh & McLennan is a globally leading insurance broker. The Zacks Consensus Estimate for MMC’s current-year earnings implies 13.7% year-over-year growth. MMC beat earnings estimates in all the last four quarters, with an average of 3.4%.
Want the latest recommendations from Zacks Investment Research? Today, you can download 7 Best Stocks for the Next 30 Days. Click to get this free report
MetLife, Inc. (MET) : Free Stock Analysis Report
Marsh & McLennan Companies, Inc. (MMC) : Free Stock Analysis Report
Employers Holdings Inc (EIG) : Free Stock Analysis Report
Ryan Specialty Holdings Inc. (RYAN) : Free Stock Analysis Report
