Is Metro Inc’s (TSE:MRU) Balance Sheet Strong Enough To Weather A Storm?

Mid-caps stocks, like Metro Inc (TSX:MRU) with a market capitalization of CA$9.41B, aren’t the focus of most investors who prefer to direct their investments towards either large-cap or small-cap stocks. However, history shows that overlooked mid-cap companies have performed better on a risk-adjusted manner than the smaller and larger segment of the market. MRU’s financial liquidity and debt position will be analysed in this article, to get an idea of whether the company can fund opportunities for strategic growth and maintain strength through economic downturns. Don’t forget that this is a general and concentrated examination of Amazon’s financial health, so you should conduct further analysis into MRU here. See our latest analysis for Metro
How does MRU’s operating cash flow stack up against its debt?
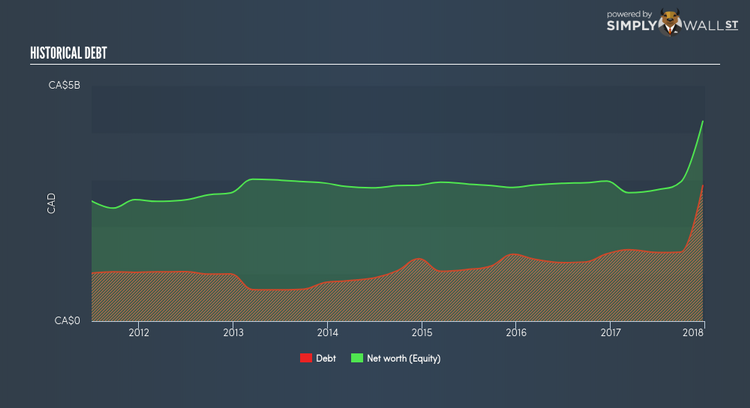
MRU’s debt levels surged from CA$1.26B to CA$1.47B over the last 12 months , which comprises of short- and long-term debt. With this rise in debt, the current cash and short-term investment levels stands at CA$148.90M , ready to deploy into the business. Moreover, MRU has produced CA$696.20M in operating cash flow during the same period of time, leading to an operating cash to total debt ratio of 47.49%, signalling that MRU’s debt is appropriately covered by operating cash. This ratio can also be a sign of operational efficiency as an alternative to return on assets. In MRU’s case, it is able to generate 0.47x cash from its debt capital.
Can MRU pay its short-term liabilities?
Looking at MRU’s most recent CA$1.29B liabilities, it seems that the business has maintained a safe level of current assets to meet its obligations, with the current ratio last standing at 1.05x. For Consumer Retailing companies, this ratio is within a sensible range since there is a bit of a cash buffer without leaving too much capital in a low-return environment.
Is MRU’s debt level acceptable?
With a debt-to-equity ratio of 67.83%, MRU can be considered as an above-average leveraged company. This is not unusual for mid-caps as debt tends to be a cheaper and faster source of funding for some businesses. We can test if MRU’s debt levels are sustainable by measuring interest payments against earnings of a company. Ideally, earnings before interest and tax (EBIT) should cover net interest by at least three times. For MRU, the ratio of 13.51x suggests that interest is comfortably covered, which means that debtors may be willing to loan the company more money, giving MRU ample headroom to grow its debt facilities.
Next Steps:
MRU’s high cash coverage means that, although its debt levels are high, the company is able to utilise its borrowings efficiently in order to generate cash flow. Since there is also no concerns around MRU’s liquidity needs, this may be its optimal capital structure for the time being. Keep in mind I haven’t considered other factors such as how MRU has been performing in the past. I recommend you continue to research Metro to get a more holistic view of the mid-cap by looking at:
Future Outlook: What are well-informed industry analysts predicting for MRU’s future growth? Take a look at our free research report of analyst consensus for MRU’s outlook.
Valuation: What is MRU worth today? Is the stock undervalued, even when its growth outlook is factored into its intrinsic value? The intrinsic value infographic in our free research report helps visualize whether MRU is currently mispriced by the market.
Other High-Performing Stocks: Are there other stocks that provide better prospects with proven track records? Explore our free list of these great stocks here.
To help readers see pass the short term volatility of the financial market, we aim to bring you a long-term focused research analysis purely driven by fundamental data. Note that our analysis does not factor in the latest price sensitive company announcements.
The author is an independent contributor and at the time of publication had no position in the stocks mentioned.
