Microsoft (MSFT) Q4 Earnings Miss on Weak Cloud Business
Microsoft MSFT reported fourth-quarter fiscal 2022 earnings of $2.23 per share, which missed the Zacks Consensus Estimate by 2.19%. The bottom line, however, climbed 2.8% on a year-over-year basis.
Revenues of $51.8 billion increased 12.4% year over year but missed the Zacks Consensus Estimate by 0.86%. On a non-GAAP basis and at constant currency (cc), revenues increased 19% year over year. Unfavorable forex hurt revenues by $595 million in the reported quarter.
Microsoft’s fourth-quarter earnings were negatively impacted by a sharp slowdown in its cloud business, declining videogame sales and the effects of a strong dollar. Unfavorable forex hurt earnings by 4 cents per share while the negative impact from the suspension of all new sales and services in Russia was a penny.
Commercial bookings climbed 25% year over year (up 35% at cc) driven by an increase in the number of larger, long-term Azure contracts.
Commercial remaining performance obligation amounted to $189 billion, up 34% year over year (up 37% at cc). The commercial revenue annuity mix was 96%, up 1% year over year, owing to the ongoing shift to cloud infrastructure.
Microsoft cloud revenues were $25 billion, up 28% year over year (up 33% at cc).
Microsoft Corporation Price, Consensus and EPS Surprise
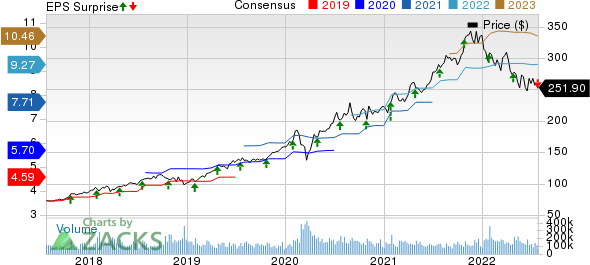
Microsoft Corporation price-consensus-eps-surprise-chart | Microsoft Corporation Quote
Segmental Details
The Productivity & Business Processes segment, which includes the Office and Dynamics CRM businesses, contributed 32% to total revenues. Revenues increased 13% (up 17% at cc) on a year-over-year basis to $16.6 billion.
Office Commercial products and cloud services revenues rose 9% (up 13% at cc) on a year-over-year basis. Office Commercial products revenues declined 32% due to continued customer shift to cloud offerings.
Office 365 commercial revenues rallied 15% (up 19% at cc), driven by Office 365 Commercial seat growth of 14%. Continued momentum in the small and medium business, as well as in frontline worker offerings, drove top-line growth. Revenue per user grew in the reported quarter.
Office Consumer products and cloud services revenues rose 9% (up 12% at cc), driven by growth in Microsoft 365 subscription revenues. Microsoft 365 Consumer subscribers totaled 59.7 million, up 15% year over year.
Dynamics products and cloud services business increased 19% (up 24% at cc) year on year. Dynamics 365 revenues surged 31% (up 36% at cc).
LinkedIn revenues advanced 26% from the year-ago quarter’s levels (up 29% at cc), driven by continued strength in Marketing Solutions and better-than-expected performance in Talent Solutions. LinkedIn sessions grew 22% with record engagement.
The Intelligent Cloud segment, including server and enterprise products and services, contributed 40.3% to total revenues. The segment reported revenues of $20.9 billion, up 20% (25%at cc) year over year.
Server product and cloud services revenues rallied 22% year over year (up 26% at cc). The high point was Azure and other cloud services’ revenues, which surged 40% year over year (up 46% at cc). The upside was driven by robust growth in consumption-based businesses.
Server products revenues decreased 2% year over year due to a strong prior-year comparable that included the benefit from an increase in multi-year agreements carrying higher in-quarter revenue recognition, offset in part by demand for its hybrid solutions and Nuance.
Enterprise mobility installed base rallied 21% to more than 230 million seats.
Enterprise service revenues increased 5% (up 8% at cc) in the reported quarter, owing to growth in Enterprise Support Services, offset in part by a decline in Microsoft Consulting Services.
More Personal Computing segment, which primarily comprises Windows, Gaming, Devices and Search businesses, contributed 27.7% to total revenues. Revenues were up 2% (5% at cc) year over year to $14.3 billion, driven by strength in Search and news advertising.
Reductions in advertising spending contributed to a negative impact on LinkedIn as well as Search and news advertising revenues of over $100 million.
Windows commercial products and cloud services revenues increased 6% year over year (up 12% at cc) on the back of higher customer adoption of Microsoft 365 offerings.
Windows OEM revenues were down 2% on a year-over-year basis. Extended production shutdowns in China that continued through May and a deteriorating PC market in June contributed to a negative impact on Windows OEM revenues of more than $300 million.
Search advertising revenues, excluding traffic acquisition costs (TAC), increased 15% (up 21% at cc), driven by higher search volume and revenue per search.
Surface revenues were up 10% (up 15% at cc) year over year driven by commercial sales.
Gaming revenues decreased 7% (down 5% at cc), driven by a decrease in Xbox content and services and Xbox hardware.
Xbox content and services revenues decreased 6% due to lower engagement hours and monetization in third-party and first-party content, offset in part by growth in Xbox Game Pass subscriptions. Xbox hardware revenues decreased 11% (down 8% at cc).
Xbox content and services revenues were down 6% year over year (down 4% at cc).
Operating Results
Gross profit increased 10.2% year over year to $35.4 billion. The gross margin was 68.3%, down 140 basis points (bps) on a year-over-year basis. Microsoft cloud gross margin was 69%, slightly down year over year.
Operating expenses increased 14.1% year over year to $14.9 billion due to investments in cloud engineering, LinkedIn and Nuance. With the ongoing war in Ukraine, the company made the decision to significantly scale down operations in Russia. As a result, Microsoft recorded operating expenses of $126 million related to bad debt expenses, asset impairments, and severance in the fiscal fourth quarter.
The operating margin contracted 180 bps on a year-over-year basis to 39.6%.
Productivity & Business Process operating income rose 12.4% to $7.2 billion. Intelligent Cloud operating income increased 11.5% to $8.6 billion. More Personal Computing operating income declined 5.2% to $4.6 billion.
Balance Sheet & Cash Flow
As of Jun 30, 2022, Microsoft had total cash, cash equivalents and short-term investments balance of $104.7 billion, which remained the same sequentially.
As of Jun 30, 2022, long-term debt (including the current portion) was $49.78 billion compared with $49.93 billion as of Mar 31, 2022.
Operating cash flow during the reported quarter was $24.6 billion compared with $25.4 billion in the previous quarter. Free cash flow during the quarter was $17.7 billion compared with $20 billion in the prior quarter.
In the reported quarter, the company returned $12.4 billion to shareholders in the form of share repurchases ($8.7 billion) and dividends payouts ($4.6 billion).
Guidance
Following the announcement, shares of the company were up 5% in after-hours trading on Jul 26, after the software maker gave an upbeat sales forecast for fiscal 2023. Year to date, shares of this Zacks Rank #4 (Sell) company have declined 25.1% compared with the Zacks Computer and Technology sector’s decrease of 27.8%.
The company expects revenues and operating income to grow by double digits in fiscal 2023, driven by demand for cloud computing services.
Currency fluctuations will cut sales by about 4% for the year and about 5% in the fiscal first quarter, indicating that the strong US dollar would have a significant impact on the value of overseas sales.
Effective at the start of fiscal 2023, Microsoft is extending the depreciable useful life for server and network equipment assets in cloud infrastructure from 4 to 6 years, which will apply to the asset balances on the balance sheet as of Jun 30, 2022, as well as future asset purchases.
Microsoft expects the effective tax rate to be roughly 19% in fiscal 2023.
For first-quarter fiscal 2023, Productivity and Business Processes revenues are anticipated between $15.95 billion and $16.25 billion.
Office Commercial revenue growth is expected to be driven by Office 365, with healthy seat growth across customer segments and higher average revenue per user growth.
Office 365 revenue growth is expected to be sequentially lower by 2% on a constant-currency basis.
Office consumer revenues are expected to grow in the low to mid-single digits, driven by Microsoft 365 subscriptions.
LinkedIn revenue growth is expected in the low to mid-teens, driven by engagement on the platform, although results will be impacted by the slowdown in advertising spend and hiring
Dynamics revenue growth is expected to be in the mid-to-high teens, driven by share growth in Dynamics 365.
Intelligent Cloud revenues are anticipated between $20.3 billion and $20.6 billion.
Azure revenue growth is expected to be down 3% sequentially on a constant-currency basis due to unfavorable forex. Overall, Azure revenues will continue to be driven by strong growth in consumption business.
Server business revenues are expected to decline in the low single digits range. Enterprise Services revenues are expected to grow in the low single-digit range.
More Personal Computing revenues are expected between $13 billion and $13.4 billion. The company expects overall Windows OEM revenues to decrease in the high single-digit range.
Windows commercial products and cloud services revenues are expected to grow in the high single-digit range, driven by demand for Microsoft 365 and advanced security solutions.
Search advertising revenues, excluding TAC, are anticipated to grow in the mid-to-high teens range, driven by growing first-party revenues and the inclusion of Xandr.
Surface revenues are anticipated to decline in the low single-digit range.
Gaming revenues are anticipated to decline in the low to mid-single digits range as a result of declines in first-party content, partially offset by growth in Game Pass subscribers and consoles.
Microsoft expects Xbox content and services revenues to decline in the low to mid-single digits.
Management expects cost of revenues between $14.9 billion and $15.1 billion. Operating expenses are anticipated to be $13.3-$13.4 billion.
Stocks to Consider
Some better-ranked stocks in the Computer and Technology sector include Meta Materials MMAT, Fastly FSLY and Aspen Technology AZPN, each carrying a Zacks Rank #2 (Buy), at present. You can see the complete list of today’s Zacks #1 Rank (Strong Buy) stocks here.
Fastly, Aspen Technology and Meta Materials are scheduled to report their quarterly results on Aug 3, Aug 8 and Aug 9, respectively.
The Zacks Consensus Estimate for Fastly’s second-quarter 2022 earnings is pegged at a loss of 16 cents per share, down 1 cent over the past 30 days.
The Zacks Consensus Estimate for Aspen Technology’s second-quarter 2022 earnings is pegged at $2.20 per share, down 2.3% over the past 30 days.
The Zacks Consensus Estimate for Meta Materials’ second-quarter 2022 loss is pegged at 5 cents per share, unchanged in the past 30 days.
Want the latest recommendations from Zacks Investment Research? Today, you can download 7 Best Stocks for the Next 30 Days. Click to get this free report
Microsoft Corporation (MSFT) : Free Stock Analysis Report
Aspen Technology, Inc. (AZPN) : Free Stock Analysis Report
Fastly, Inc. (FSLY) : Free Stock Analysis Report
Meta Materials Inc. (MMAT) : Free Stock Analysis Report
To read this article on Zacks.com click here.
Zacks Investment Research
